安装 Prometheus Server
macOS
$ export VERSION=2.19.2
$ curl -LO  https://github.com/prometheus/prometheus/releases/download/v$VERSION/prometheus-$VERSION.darwin-amd64.tar.gz
$ tar -xzf prometheus-${VERSION}.darwin-amd64.tar.gz
$ cd prometheus-${VERSION}.darwin-amd64
Linux
$ curl -LO https://github.com/prometheus/prometheus/releases/download/v2.19.2/prometheus-2.19.2.linux-amd64.tar.gz
$ tar -xzf prometheus-2.19.2.linux-amd64.tar.gz
$ cd prometheus-2.19.2.linux-amd64/
Via Docker
# Run by background mode
$ docker run -d -p 9090:9090 prom/prometheus

# create the config file
$ mkdir prometheus_config; cd prometheus_config; touch prometheus.yml

# 如果希望设置为在宿主机开机后,这个 prometheus Docker instance 也一直运行
$ docker run -d \
--name prometheus \
-v /etc/localtime:/etc/localtime:ro \
-v /etc/timezone:/etc/timezone \
--restart unless-stopped \
-p 9090:9090 \
-v /home/sw/prometheus_config:/etc/prometheus \
prom/prometheus
解压后当前目录会包含默认的Prometheus配置文件 promethes.yml:
# my global config
global:
  scrape_interval:     15s # Set the scrape interval to every 15 seconds. Default is every 1 minute.
  evaluation_interval: 15s # Evaluate rules every 15 seconds. The default is every 1 minute.
  # scrape_timeout is set to the global default (10s).

# Alertmanager configuration
alerting:
  alertmanagers:
  - static_configs:
    - targets:
      # - alertmanager:9093

# Load rules once and periodically evaluate them according to the global 'evaluation_interval'.
rule_files:
  # - "first_rules.yml"
  # - "second_rules.yml"

# A scrape configuration containing exactly one endpoint to scrape:
# Here it's Prometheus itself.
scrape_configs:
  # The job name is added as a label `job=<job_name>` to any timeseries scraped from this config.
  - job_name: 'prometheus'

    # metrics_path defaults to '/metrics'
    # scheme defaults to 'http'.

    static_configs:
    - targets: ['localhost:9090']
Promtheus作为一个时间序列数据库,其采集的数据会以文件的形式存储在本地中,默认的存储路径为data/,因此我们需要先手动创建该目录:
$ mkdir -p data
用户也可以通过参数--storage.tsdb.path="data/"修改本地数据存储的路径。
启动prometheus服务,其会默认加载当前路径下的prometheus.yaml文件:
$ ./prometheus

# Or
$ nohup /home/parallels/prometheus-2.19.2.linux-amd64/prometheus &
正常的情况下,你可以看到以下输出内容:
level=info ts=2018-10-23T14:55:14.499484Z caller=main.go:554 msg="Starting TSDB ..."
level=info ts=2018-10-23T14:55:14.499531Z caller=web.go:397 component=web msg="Start listening for connections" address=0.0.0.0:9090
level=info ts=2018-10-23T14:55:14.507999Z caller=main.go:564 msg="TSDB started"
level=info ts=2018-10-23T14:55:14.508068Z caller=main.go:624 msg="Loading configuration file" filename=prometheus.yml
level=info ts=2018-10-23T14:55:14.509509Z caller=main.go:650 msg="Completed loading of configuration file" filename=prometheus.yml
level=info ts=2018-10-23T14:55:14.509537Z caller=main.go:523 msg="Server is ready to receive web requests."
安装Node Exporter
在Prometheus的架构设计中,Prometheus Server并不直接服务监控特定的目标,其主要任务负责数据的收集,存储并且对外提供数据查询支持。因此为了能够能够监控到某些东西,如主机的CPU使用率,我们需要使用到Exporter。Prometheus周期性的从Exporter暴露的HTTP服务地址(通常是/metrics)拉取监控样本数据。
从上面的描述中可以看出Exporter可以是一个相对开放的概念,其可以是一个独立运行的程序独立于监控目标以外,也可以是直接内置在监控目标中。只要能够向Prometheus提供标准格式的监控样本数据即可。
这里为了能够采集到主机的运行指标如CPU, 内存,磁盘等信息。我们可以使用Node Exporter。
Node Exporter同样采用Golang编写,并且不存在任何的第三方依赖,只需要下载,解压即可运行。可以从 https://prometheus.io/download/ 获取最新的node exporter版本的二进制包。
macOS
$ curl -OL https://github.com/prometheus/node_exporter/releases/download/v1.0.1/node_exporter-1.0.1.darwin-amd64.tar.gz
$ tar -xzf node_exporter-1.0.1.darwin-amd64.tar.gz
Linux
$ curl -OL https://github.com/prometheus/node_exporter/releases/download/v1.0.1/node_exporter-1.0.1.linux-amd64.tar.gz
$ tar -xzf node_exporter-1.0.1.darwin-amd64.tar.gz
运行node exporter:
$ cd node_exporter-1.0.1.darwin-amd64
$ ./node_exporter
启动成功后,可以看到以下输出:
INFO[0000] Listening on :9100 source="node_exporter.go:76"
访问http://localhost:9100/可以看到以下页面:
初始Node Exporter监控指标
访问http://localhost:9100/metrics ,可以看到当前node exporter获取到的当前主机的所有监控数据,如下所示:
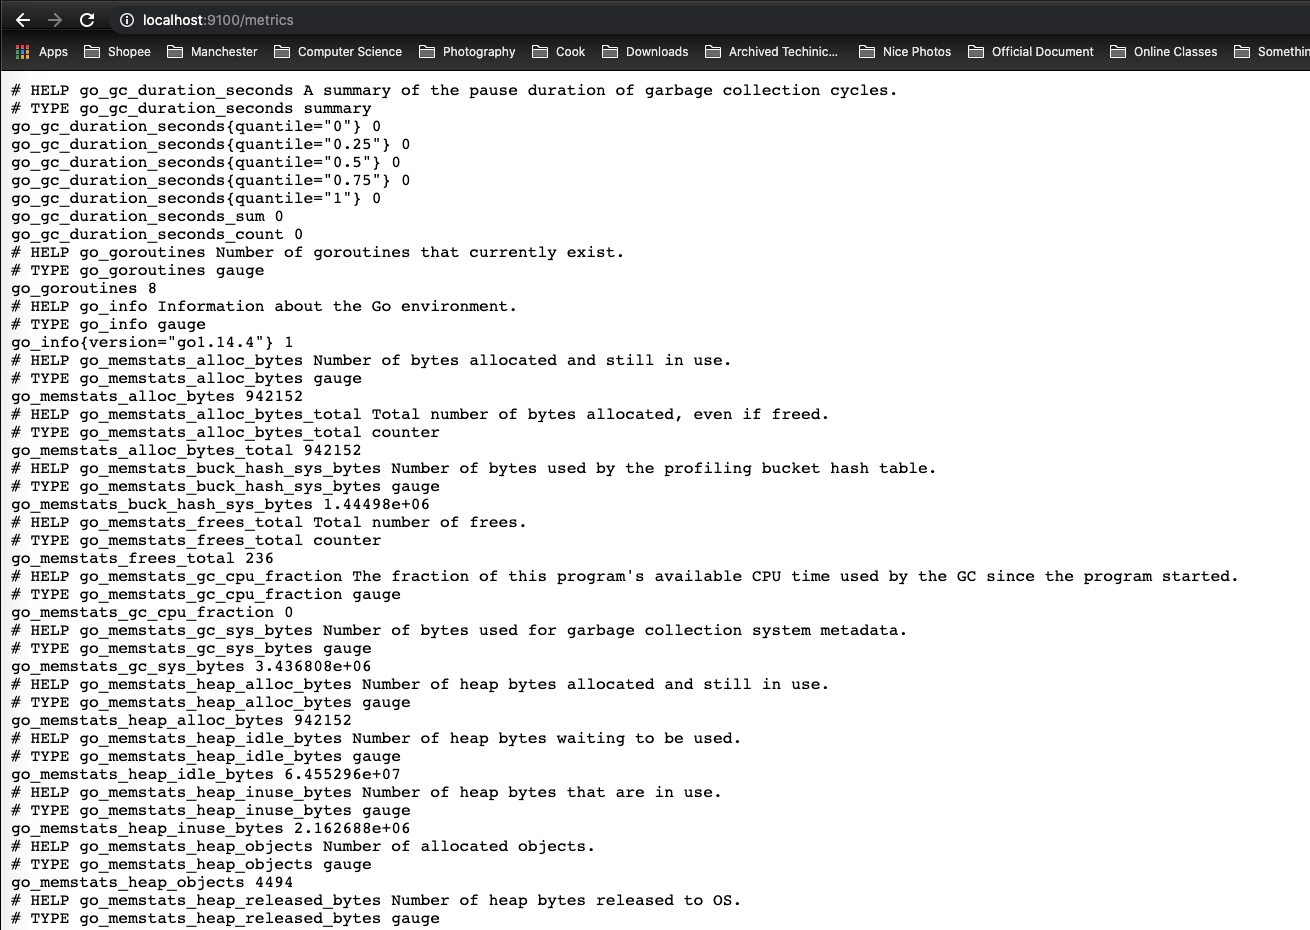
每一个监控指标之前都会有一段类似于如下形式的信息:
# HELP node_cpu Seconds the cpus spent in each mode.
# TYPE node_cpu counter
node_cpu{cpu="cpu0",mode="idle"} 362812.7890625
# HELP node_load1 1m load average.
# TYPE node_load1 gauge
node_load1 3.0703125
其中HELP用于解释当前指标的含义,TYPE则说明当前指标的数据类型。在上面的例子中node_cpu的注释表明当前指标是cpu0上idle进程占用CPU的总时间,CPU占用时间是一个只增不减的度量指标,从类型中也可以看出node_cpu的数据类型是计数器(counter),与该指标的实际含义一致。又例如node_load1该指标反映了当前主机在最近一分钟以内的负载情况,系统的负载情况会随系统资源的使用而变化,因此node_load1反映的是当前状态,数据可能增加也可能减少,从注释中可以看出当前指标类型为仪表盘(gauge),与指标反映的实际含义一致。
除了这些以外,在当前页面中根据物理主机系统的不同,你还可能看到如下监控指标:
- node_boot_time:系统启动时间
- node_cpu:系统CPU使用量
- node*disk**:磁盘IO
- node*filesystem**:文件系统用量
- node_load1:系统负载
- node*memeory**:内存使用量
- node*network**:网络带宽
- node_time:当前系统时间
- go_*:node exporter中go相关指标
- process_*:node exporter自身进程相关运行指标