Memory Profiling
默认情况下,统计的是当前内存使用数(字节数或对象数量),即使用 --inuse_objects 。
除此之外,我们还可以使用--alloc-space 来查看和分析当前截止每当前时刻已分配内存的总和(字节数或对象数量),比如每次为一个struct 分配一块新内存空间,都会计数在内(即使在分配之后,马上被GC回收了。而前者来说,就会考虑)。
| Name | Meaning |
|---|---|
| inuse_space | amount of memory allocated and not released yet |
| inuse_objects | amount of objects allocated and not released yet |
| alloc_space | total amount of memory allocated (regardless of released) |
| alloc_objects | total amount of objects allocated (regardless of released) |
消耗较多内存可能属于以下情况中其中一种:
- 初始化一个占用较大内存块的对象或多个对象(且他们占用的总内存交大),且初始化后不释放
- 程序运行占用较大的内存,可以通过
inuse_space来体现 - 不断在初始化多个对象,且占用较多的内存,可以通过
inuse_objects和alloc_objects来体现
- 程序运行占用较大的内存,可以通过
- 存在非常频繁的GC活动,通常意味着
alloc_space非常高,而程序运行过程中并没有消耗太多的内存(体现为inuse_space并不高)- 当然也可能出现GC来不及回收,因此出现
inuse_space也变高的情况
- 当然也可能出现GC来不及回收,因此出现
- 内存泄漏,通常
alloc_space较高,且inuse_space也较高
Demo 1 - 内存使用巨头(不释放)
package main

import (
	"net/http"
	_ "net/http/pprof"
)

const (
	KB = 1024
	MB = 1024 * KB
	GB = 1024 * MB
)

type StupidStruct struct {
	buffer [][MB]byte
}

var m = StupidStruct{}

func main() {
	go func() {

		stupidMemoryUse()

	}()

	http.ListenAndServe("0.0.0.0:6060", nil)
}

func stupidMemoryUse() {

	max := GB
	for len(m.buffer)*MB < max {
		m.buffer = append(m.buffer, [MB]byte{})
	}
}
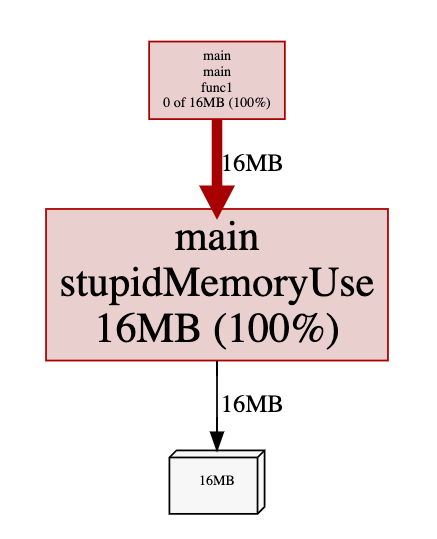
我们来看一个简单的例子,m 中会持有一个内存占用为1G的 array,且当内存占用达到1G时,不释放任何空间。

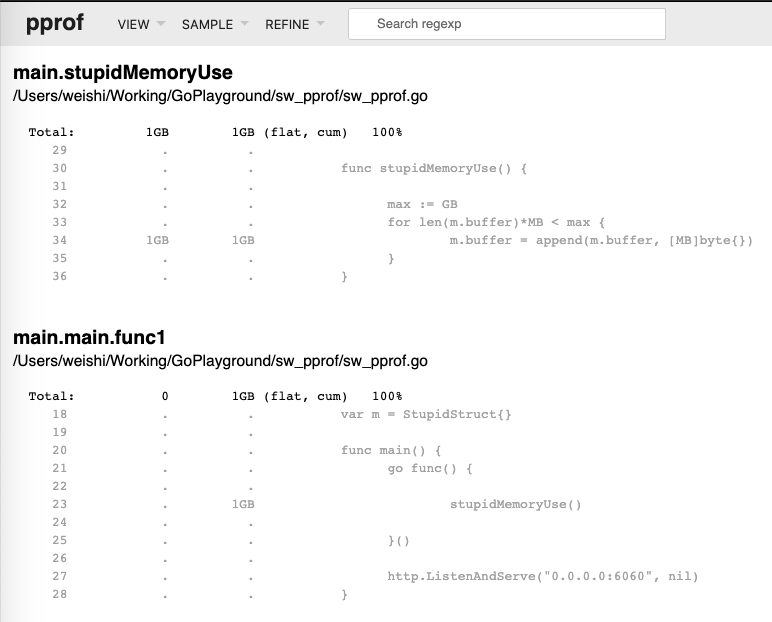
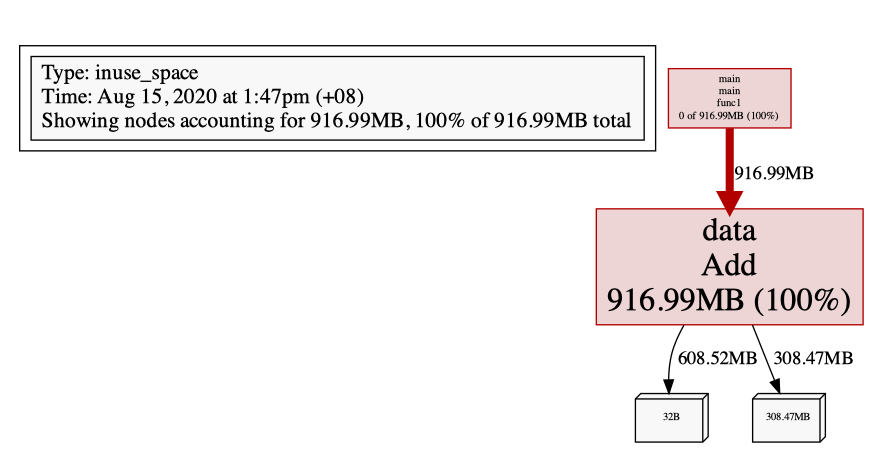
inuse_space
可以看到,确实占用了 1G内存,而且不会去释放:
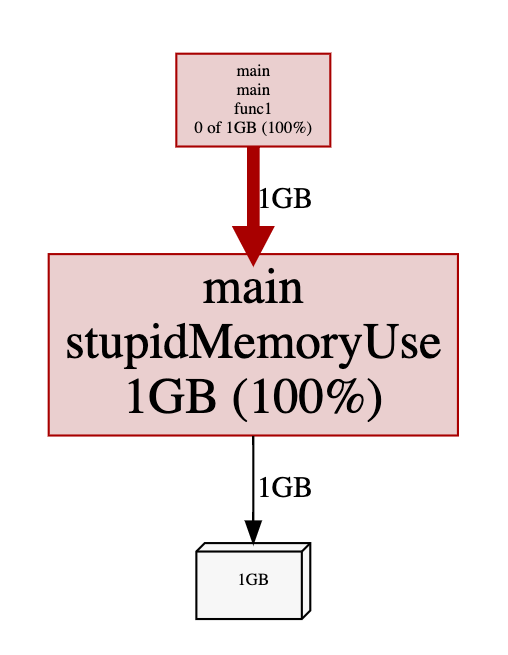
问题代码定位:
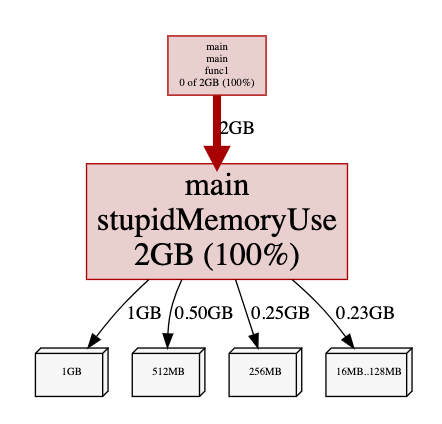
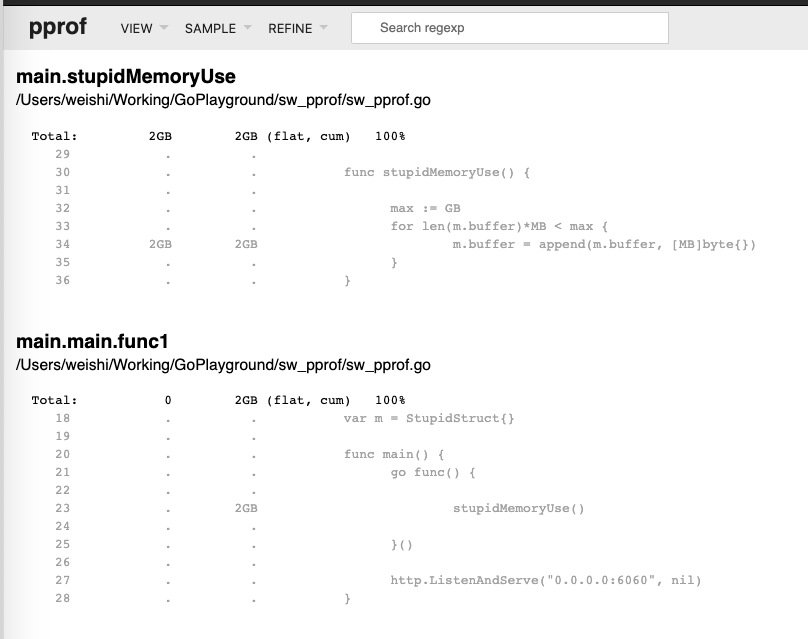
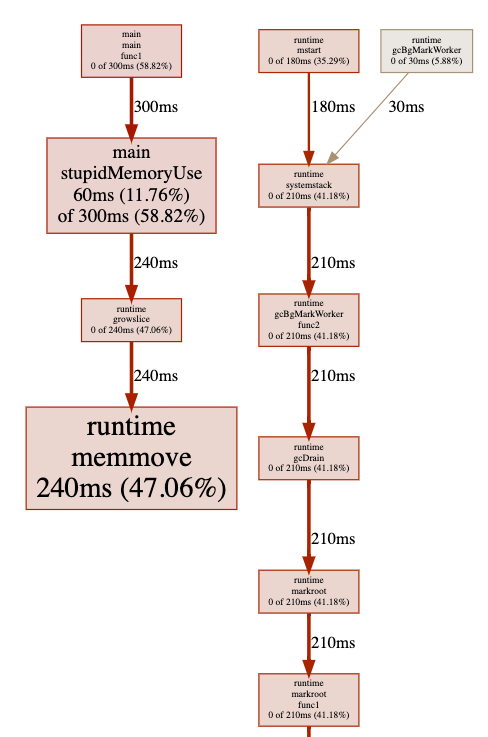
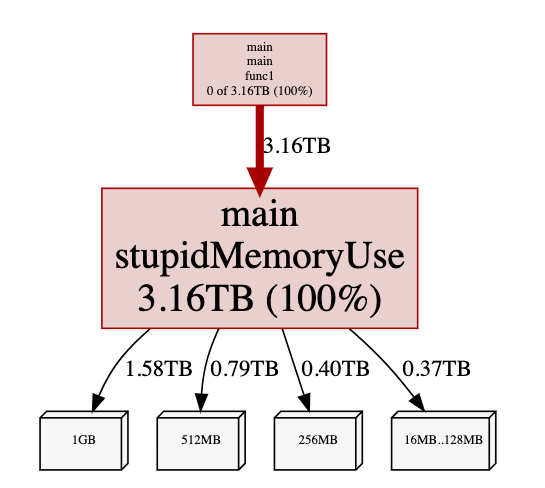
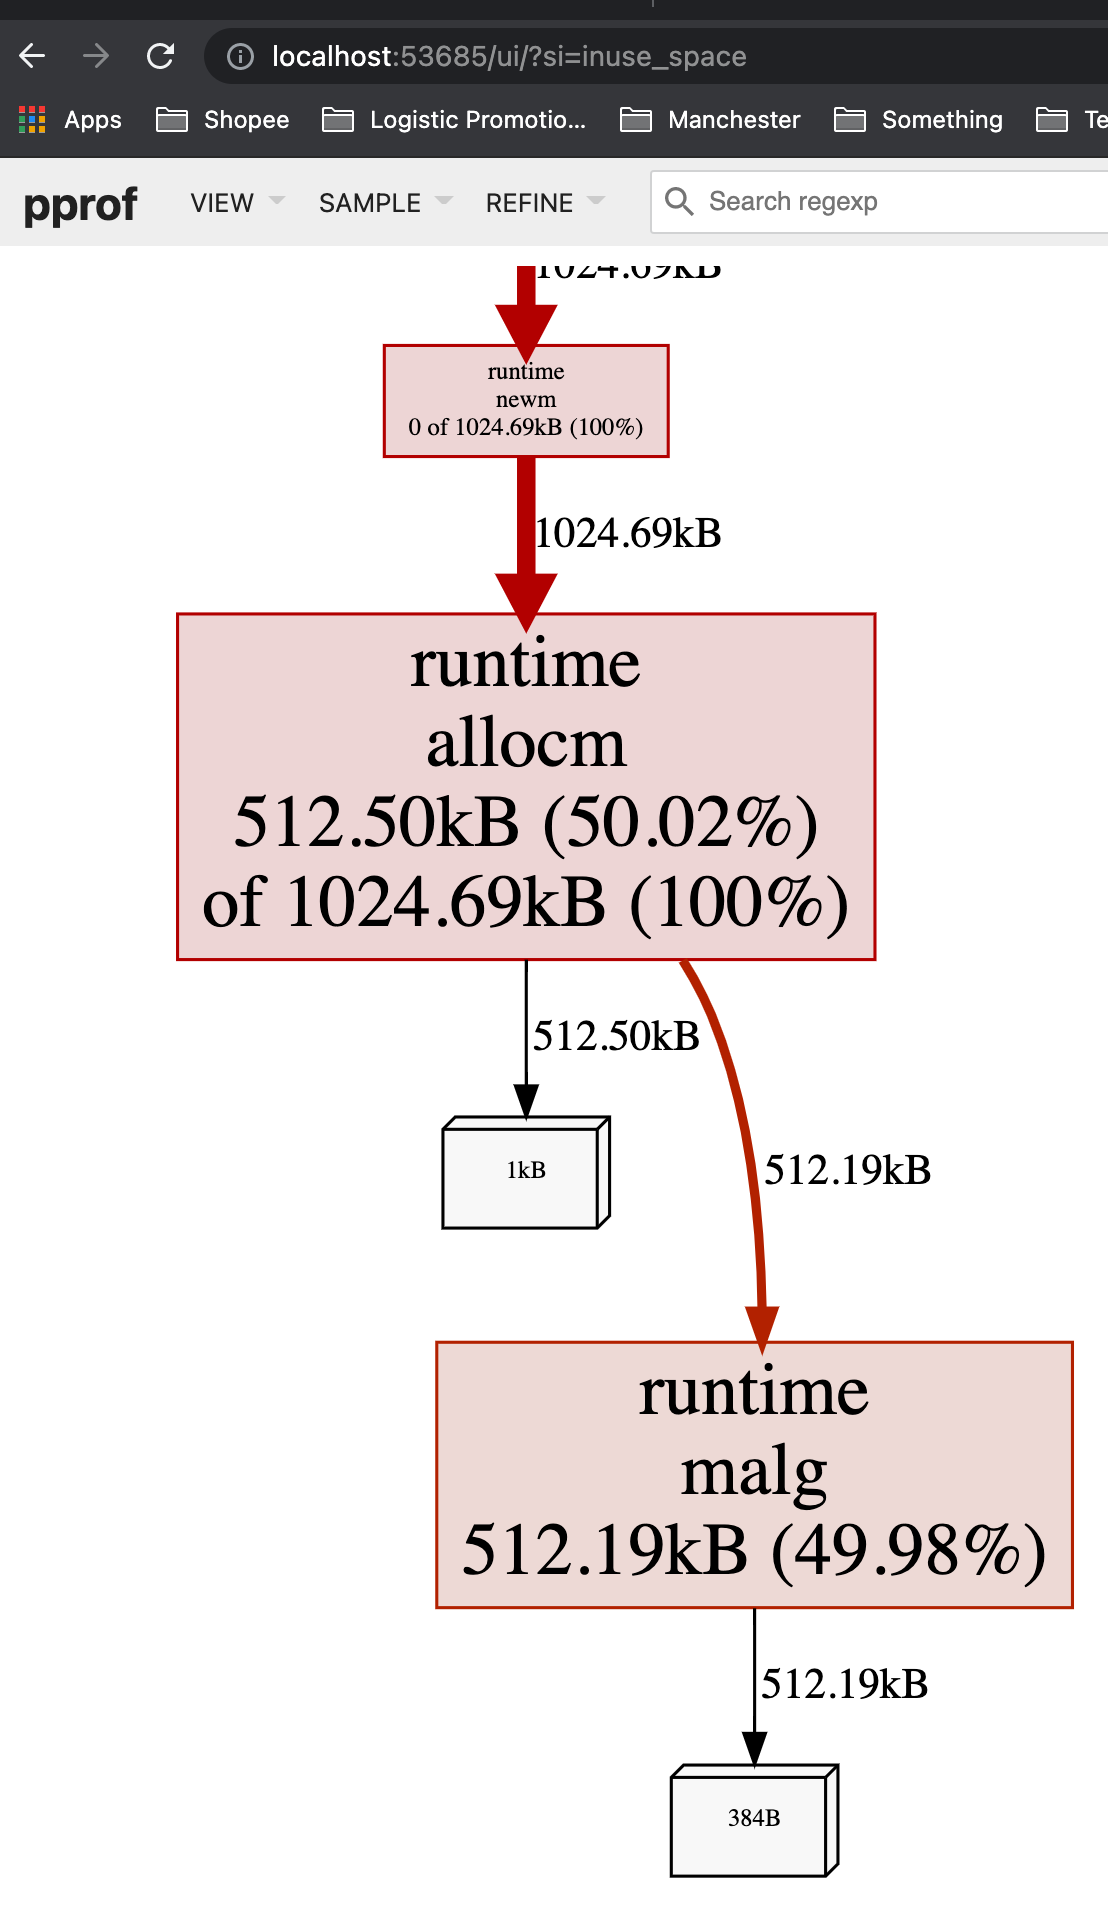
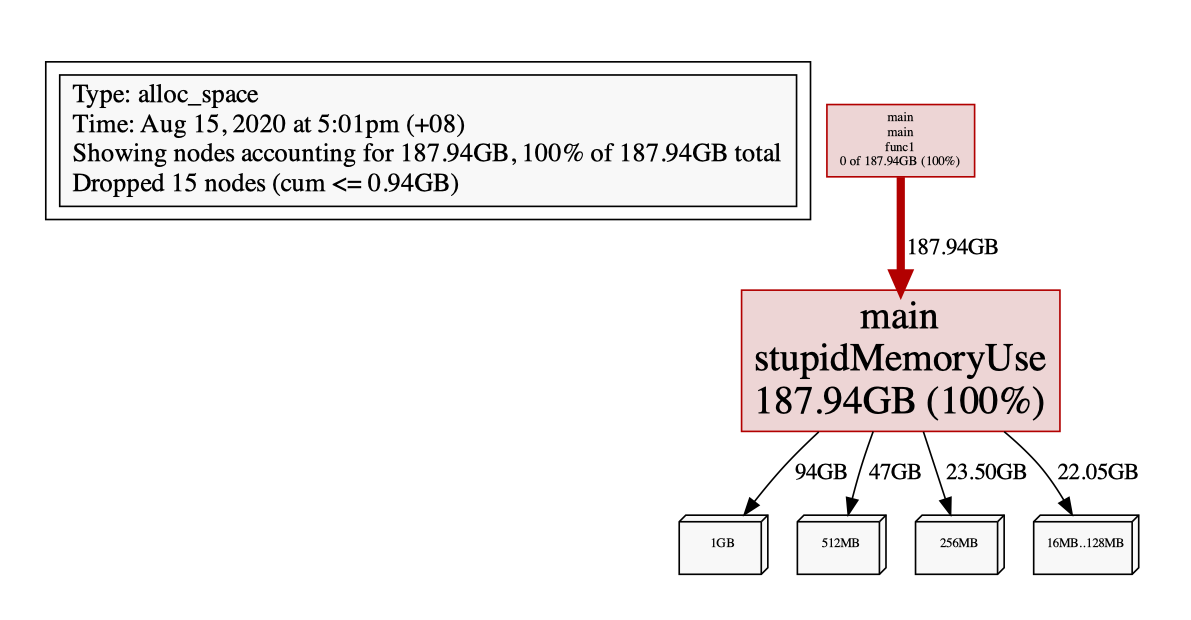
alloc_space
alloc_space 为 2G(> 1G),是因为我们在 append 的过程中,会需要不断的重新分配新的内存区域,因为 > 1G。
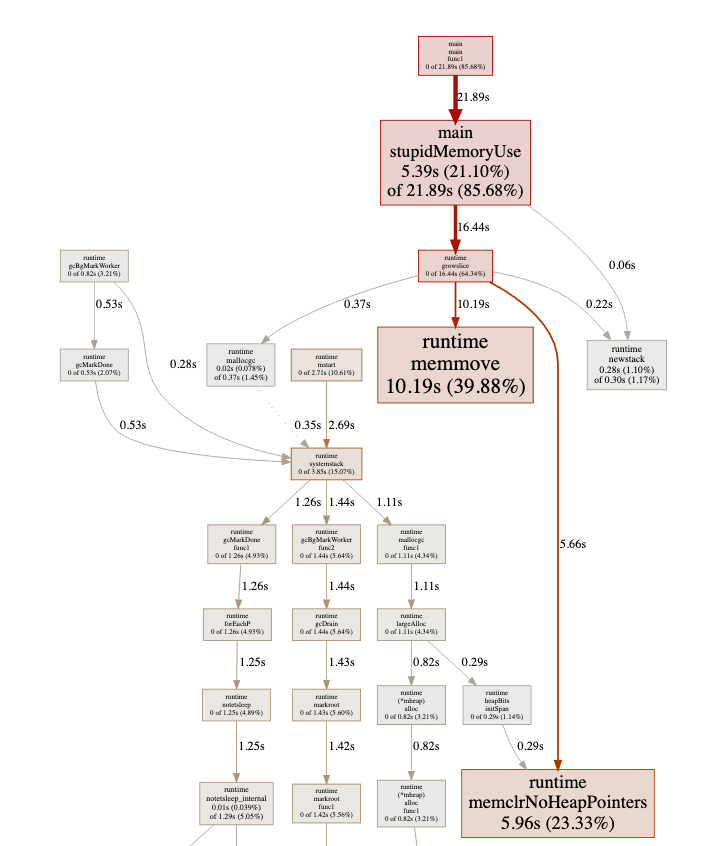
对其进行 CPU Profiling 也能看出来存在频繁的内存空间移动和GC:
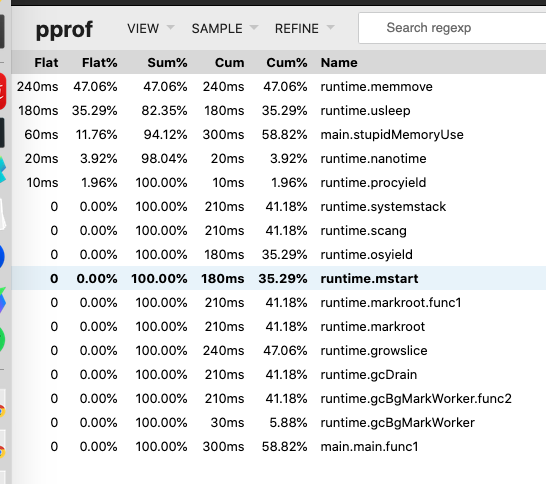
$ go tool pprof http://localhost:6060/debug/pprof/heap
Fetching profile over HTTP from http://localhost:6060/debug/pprof/heap
Saved profile in /Users/weishi/pprof/pprof.alloc_objects.alloc_space.inuse_objects.inuse_space.001.pb.gz
Type: inuse_space
Time: Aug 15, 2020 at 1:47pm (+08)
Entering interactive mode (type "help" for commands, "o" for options)
(pprof) top
Showing nodes accounting for 916.99MB, 100% of 916.99MB total
      flat  flat%   sum%        cum   cum%
  916.99MB   100%   100%   916.99MB   100%  GoPlayground/sw_pprof/data.Add
         0     0%   100%   916.99MB   100%  main.main.func1
(pprof) pdf
Generating report in profile003.pdf
(pprof)
Demo 2 - 频繁GC
Example 1
以下是一个不断向 buffer 里追加长度为 1 MiB 的数组,直到总容量到达 1 GiB 为止,然后不断做这个循环的例子:
package main

import (
	"net/http"
	_ "net/http/pprof"
)

const (
	KB = 1024
	MB = 1024 * KB
	GB = 1024 * MB
)

func main() {
	go func() {
		for {
			stupidMemoryUse()
		}
	}()

	http.ListenAndServe("0.0.0.0:6060", nil)
}

func stupidMemoryUse() {
	var buffer [][MB]byte
	max := GB
	for len(buffer)*MB < max {
		buffer = append(buffer, [MB]byte{})
	}
}
同样,启动该程序后,等待一会儿,然后启动分析。
inuse_space
inuse_space 会比较低(一定< 1G),因为这取决于采集那一小段过程中触发的内存分配:
alloc_space
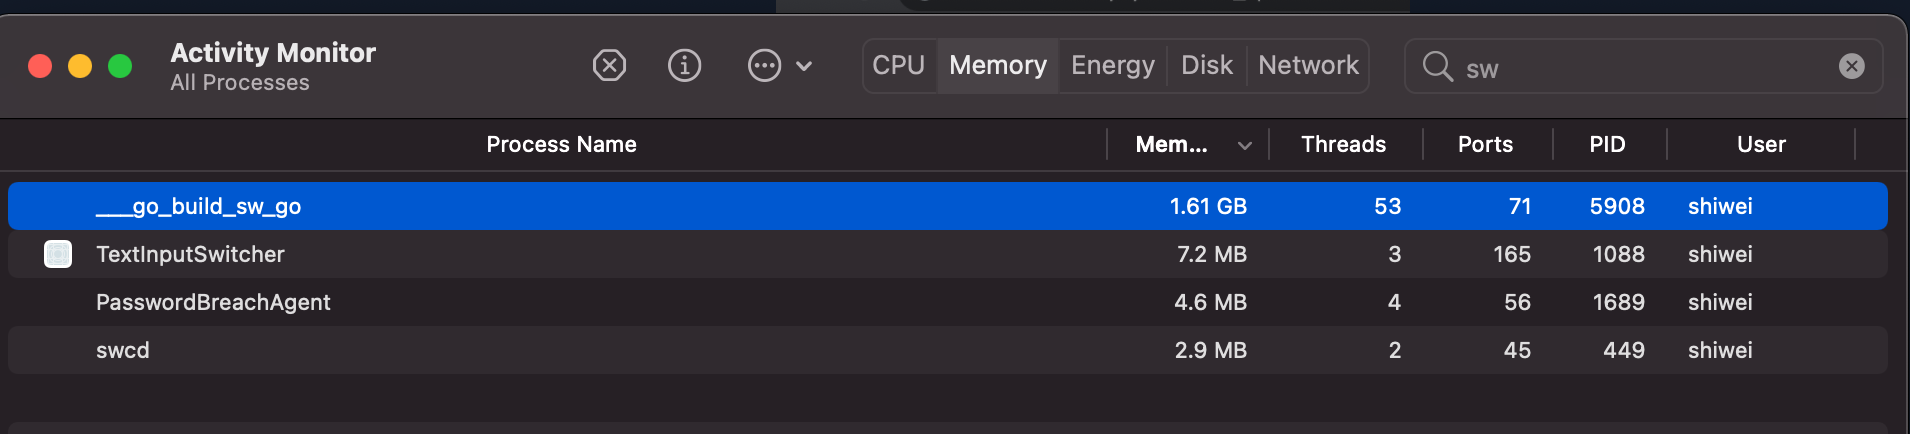
alloc_space 就非常夸张了,因为会不断分配内存,当达到 1G后,就等待GC回收,然后不断请求分配内存….
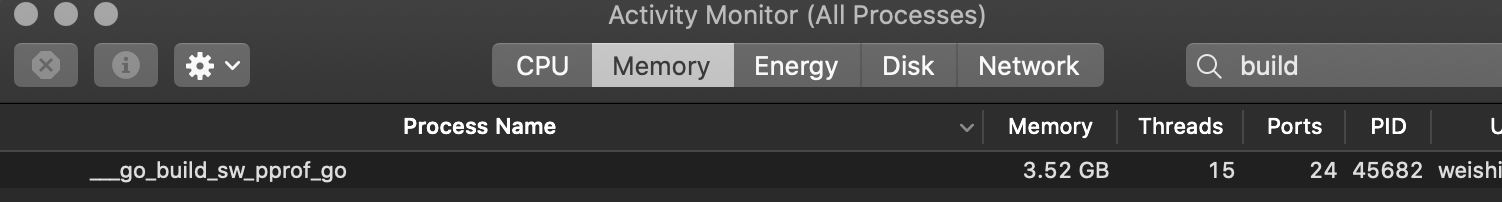
由于来不及进行 GC,程序的实际内存占用会很高,同时 swap memory也会被很快被吃掉:
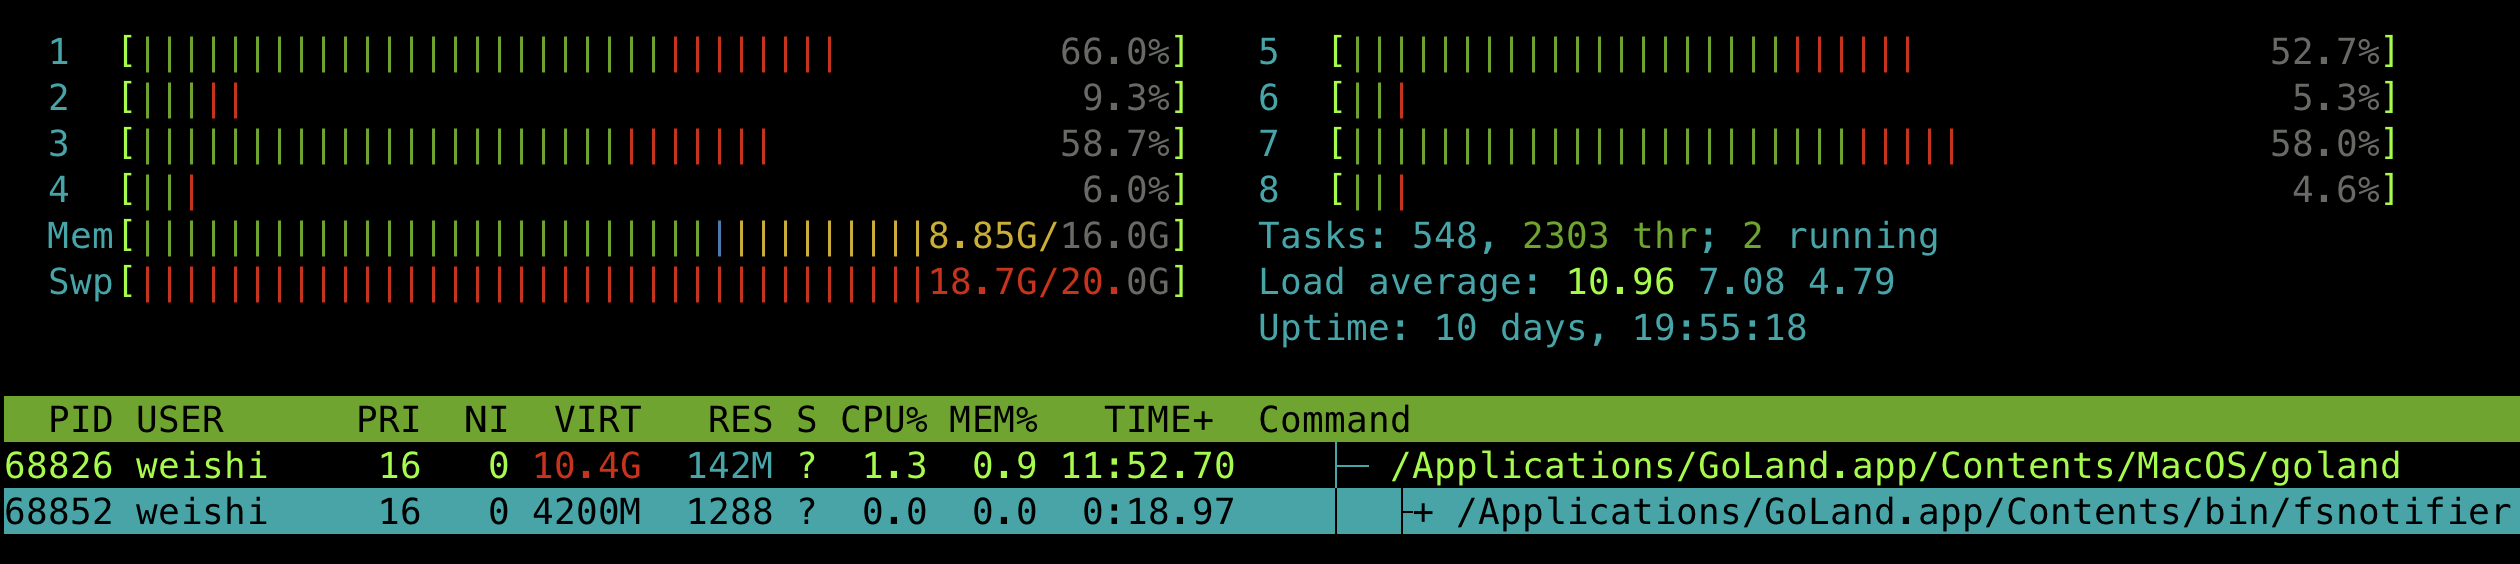
同时也需要消耗大量的CPU来进行 GC:
Example 2
在这个程序中,每当产生一个 /example2的请求时,都会创建一段内存,并用于进行一些后续的工作。
package main

import (
	"fmt"
	"net/http"
	_ "net/http/pprof"
)

func newBuf() []byte {
	return make([]byte, 10<<20)
}
func main() {
	go func() {
		http.ListenAndServe("localhost:6060", nil)
	}()
	http.HandleFunc("/example2", func(w http.ResponseWriter, r *http.Request) {
		b := newBuf()
		// 模拟执行一些工作
		for idx := range b {
			b[idx] = 1
		}
		fmt.Fprintf(w, "done, %v", r.URL.Path[1:])
	})
	http.ListenAndServe(":8080", nil)
}
为了进行性能分析,我们还额外创建了一个监听 6060 端口的 goroutine,用于使用 pprof 进行分析。我们先让服务器跑起来:
$ go run main.go
...
这时候我们使用一个压测工具 ab,来同时产生 5000 个请求(-n 一共 5000 个请求,-c 表示每次执行请求的数量,每次 100 个并发请求):
$ ab -k -n 5000 -c 100 http://127.0.0.1:8080/example2
...
Requests per second: 504.61 [#/sec] (mean)
Time per request: 198.173 [ms] (mean)
Time per request: 1.982 [ms] (mean, across all concurrent requests)
Transfer rate: 76.38 [Kbytes/sec] received
Connection Times (ms)
min mean[+/-sd] median max
Connect: 0 0 2.1 0 21
Processing: 9 197 160.1 125 1134
Waiting: 6 196 160.1 124 1134
Total: 9 197 160.1 125 1134
...
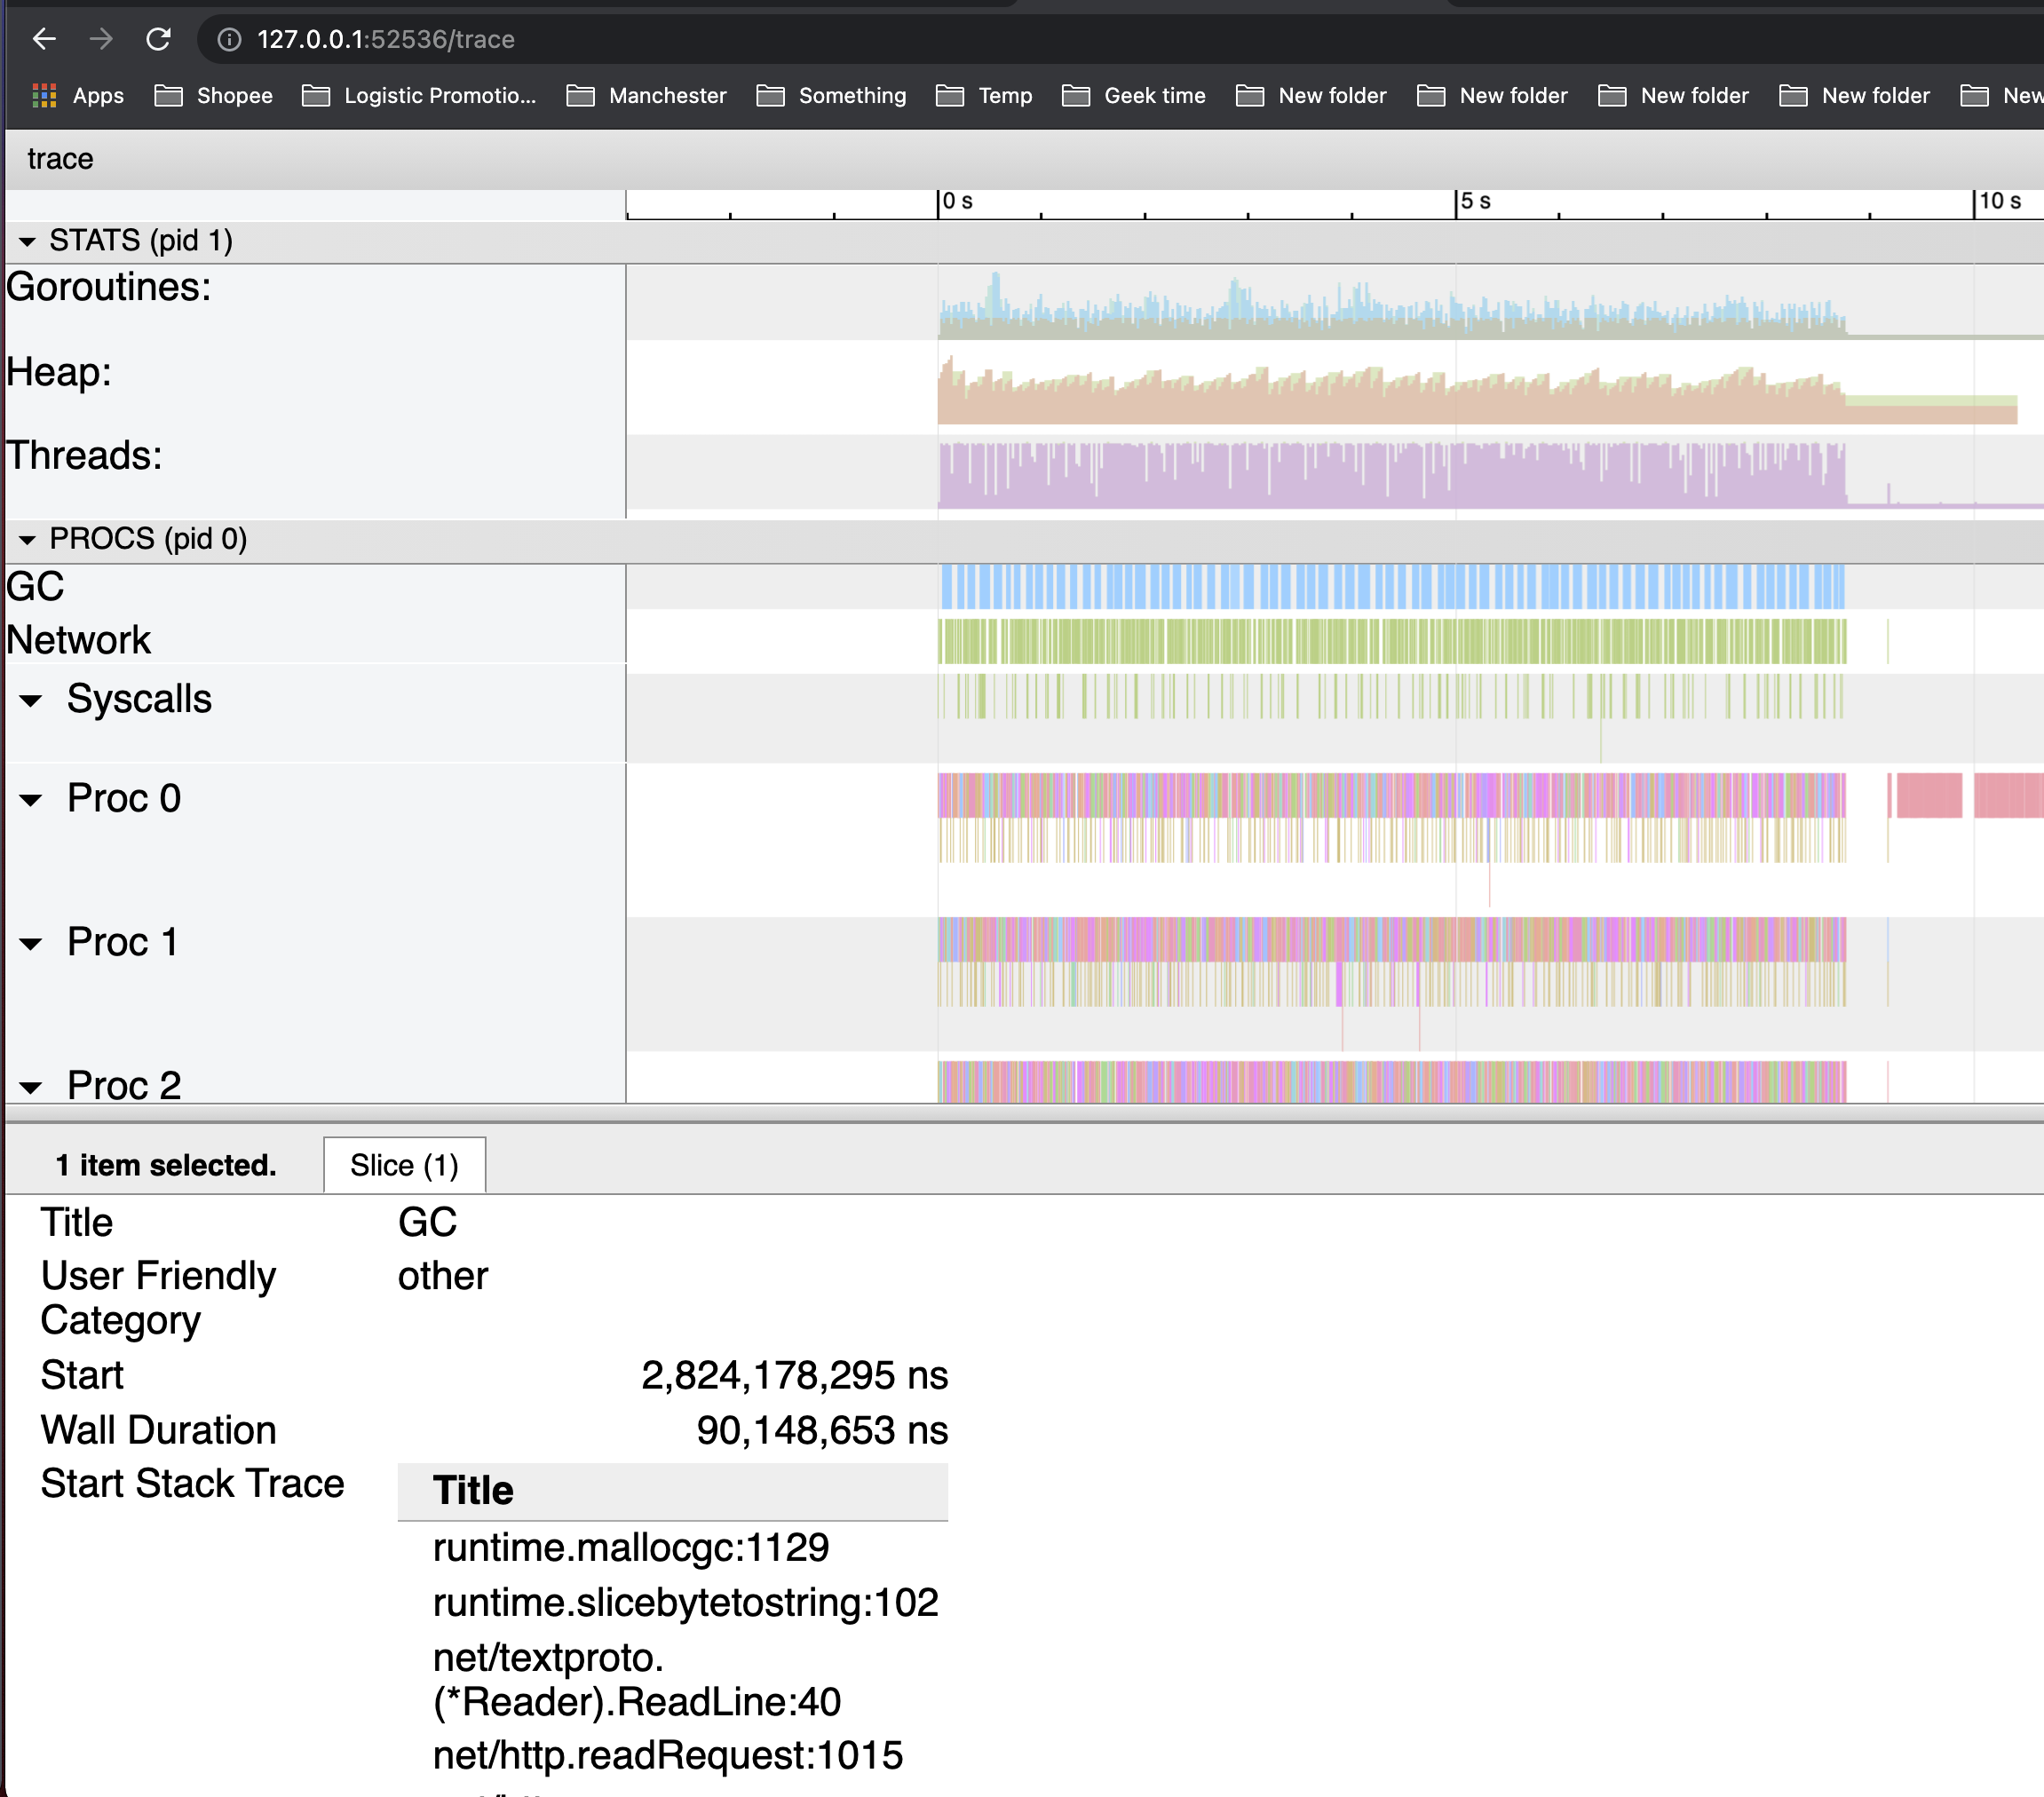
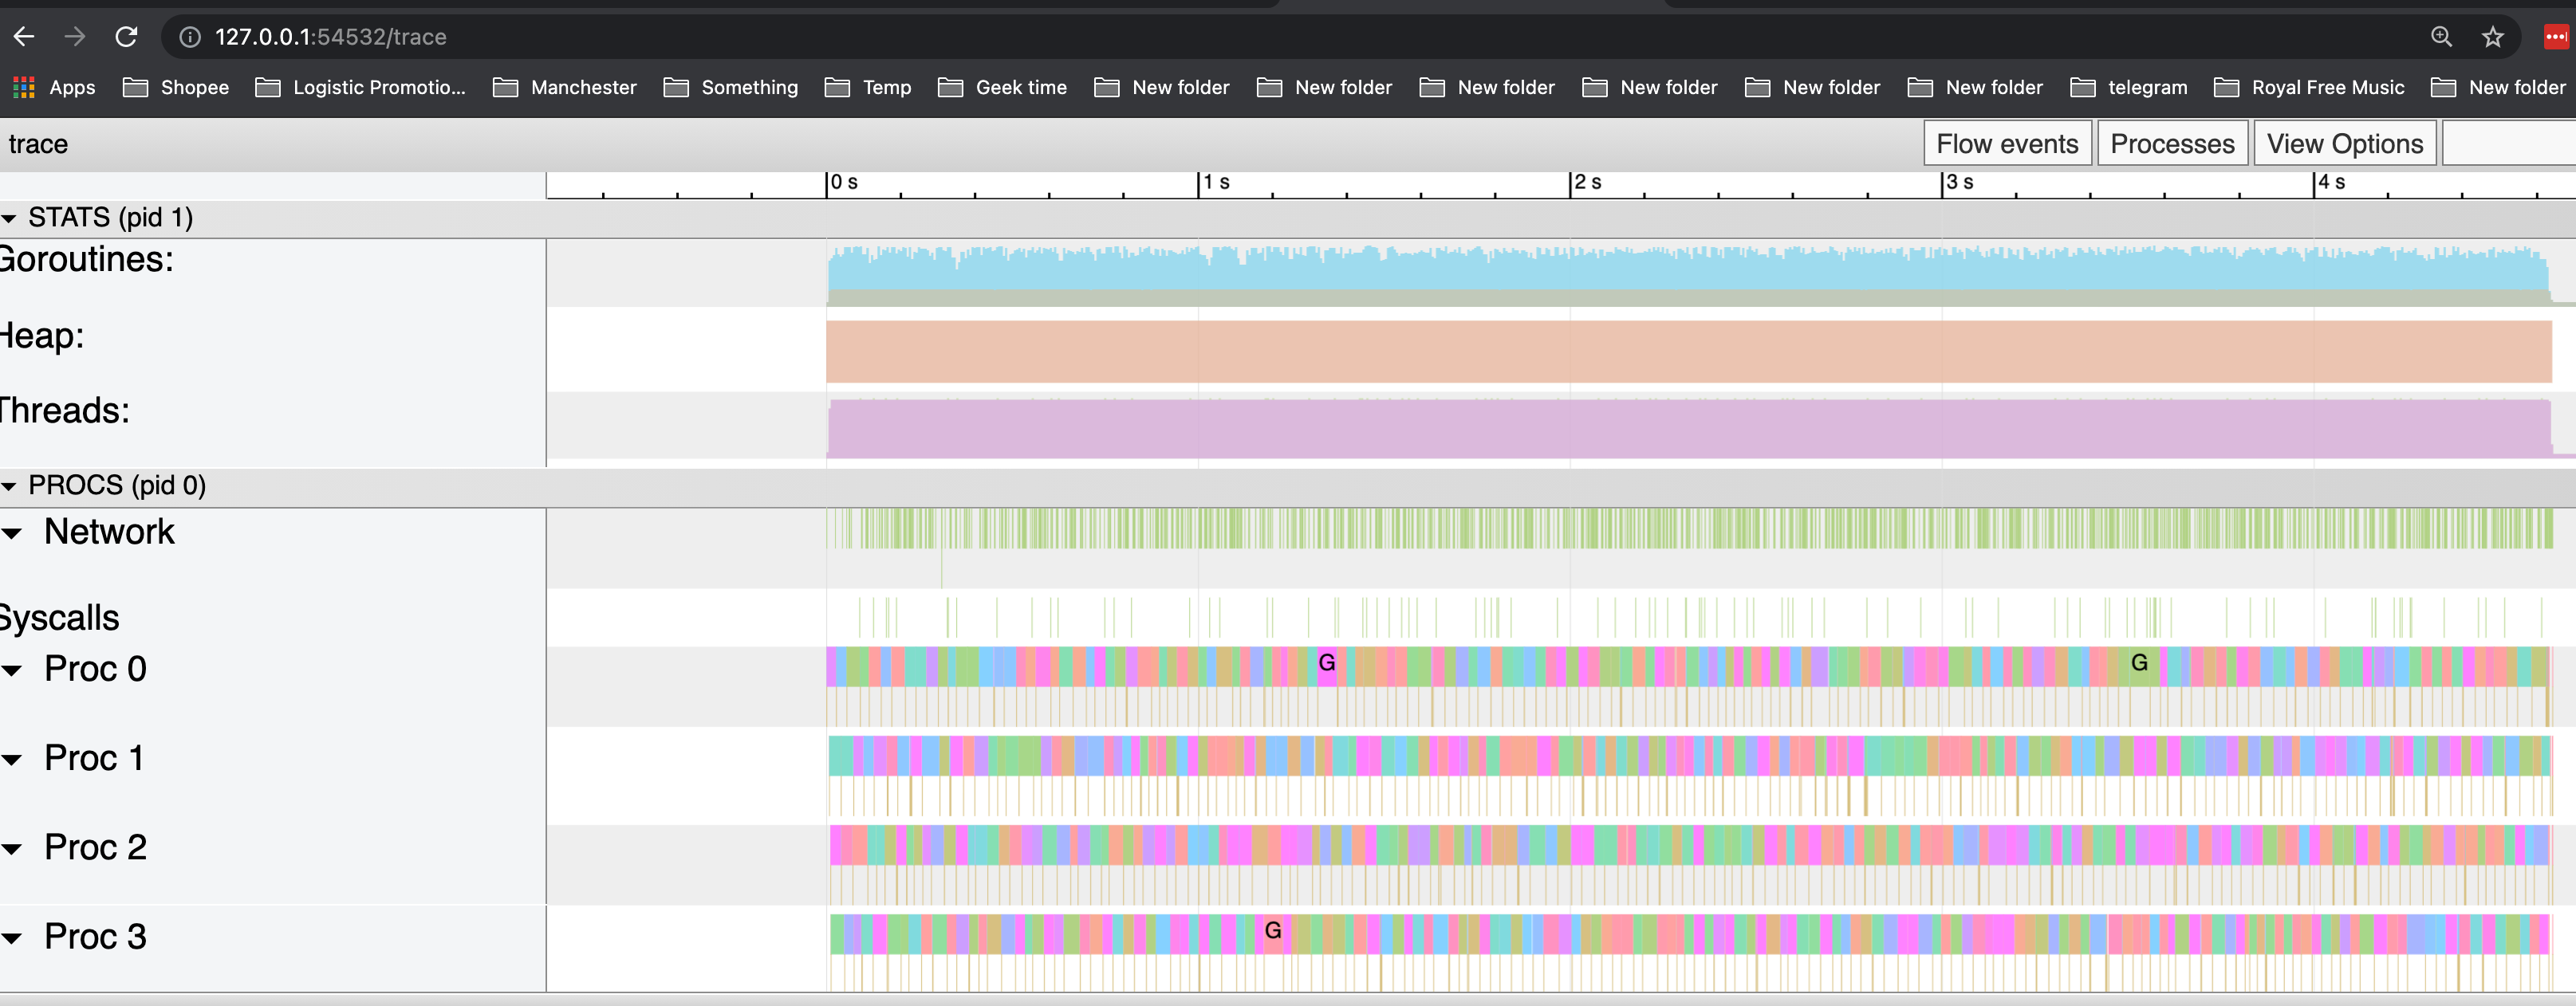
# At the same time
$ wget http://127.0.0.1:6060/debug/pprof/trace\?seconds\=5 -O /tmp/trace.out && go tool trace /tmp/trace.out
可以看到,GC 反复被触发,一个显而易见的原因就是内存分配过多。
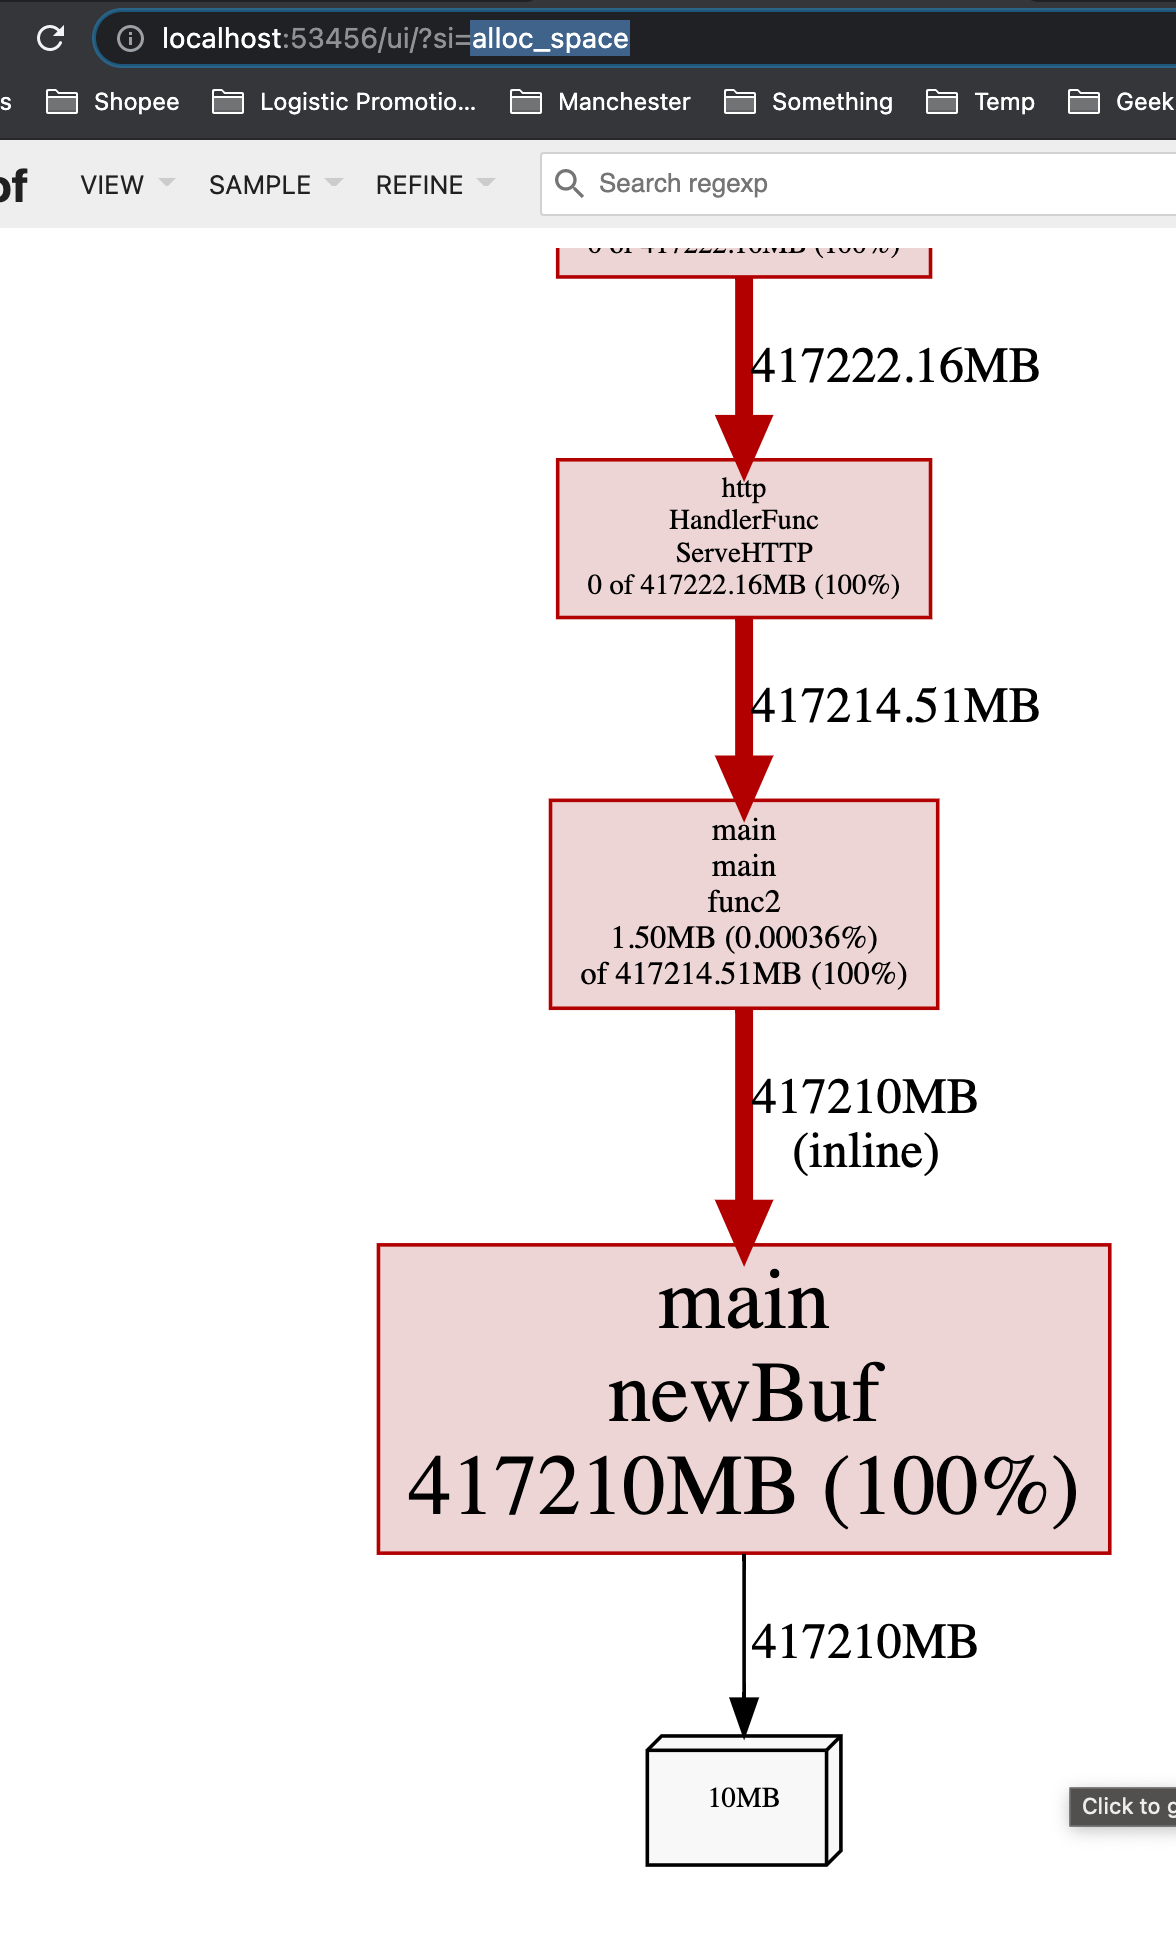
我们可以通过 go tool pprof 来查看究竟是谁分配了大量内存(alloc_space)。
$ go tool pprof -http : http://127.0.0.1:6060/debug/pprof/heap
Fetching profile over HTTP from http://127.0.0.1:6060/debug/pprof/heap
Saved profile in /Users/shiwei/pprof/pprof.alloc_objects.alloc_space.inuse_objects.inuse_space.003.pb.gz
Serving web UI on http://localhost:53456
从inuse_space来看也很高,这意味着这个app在运行时,如果一处理request,就会占用很大的内存:
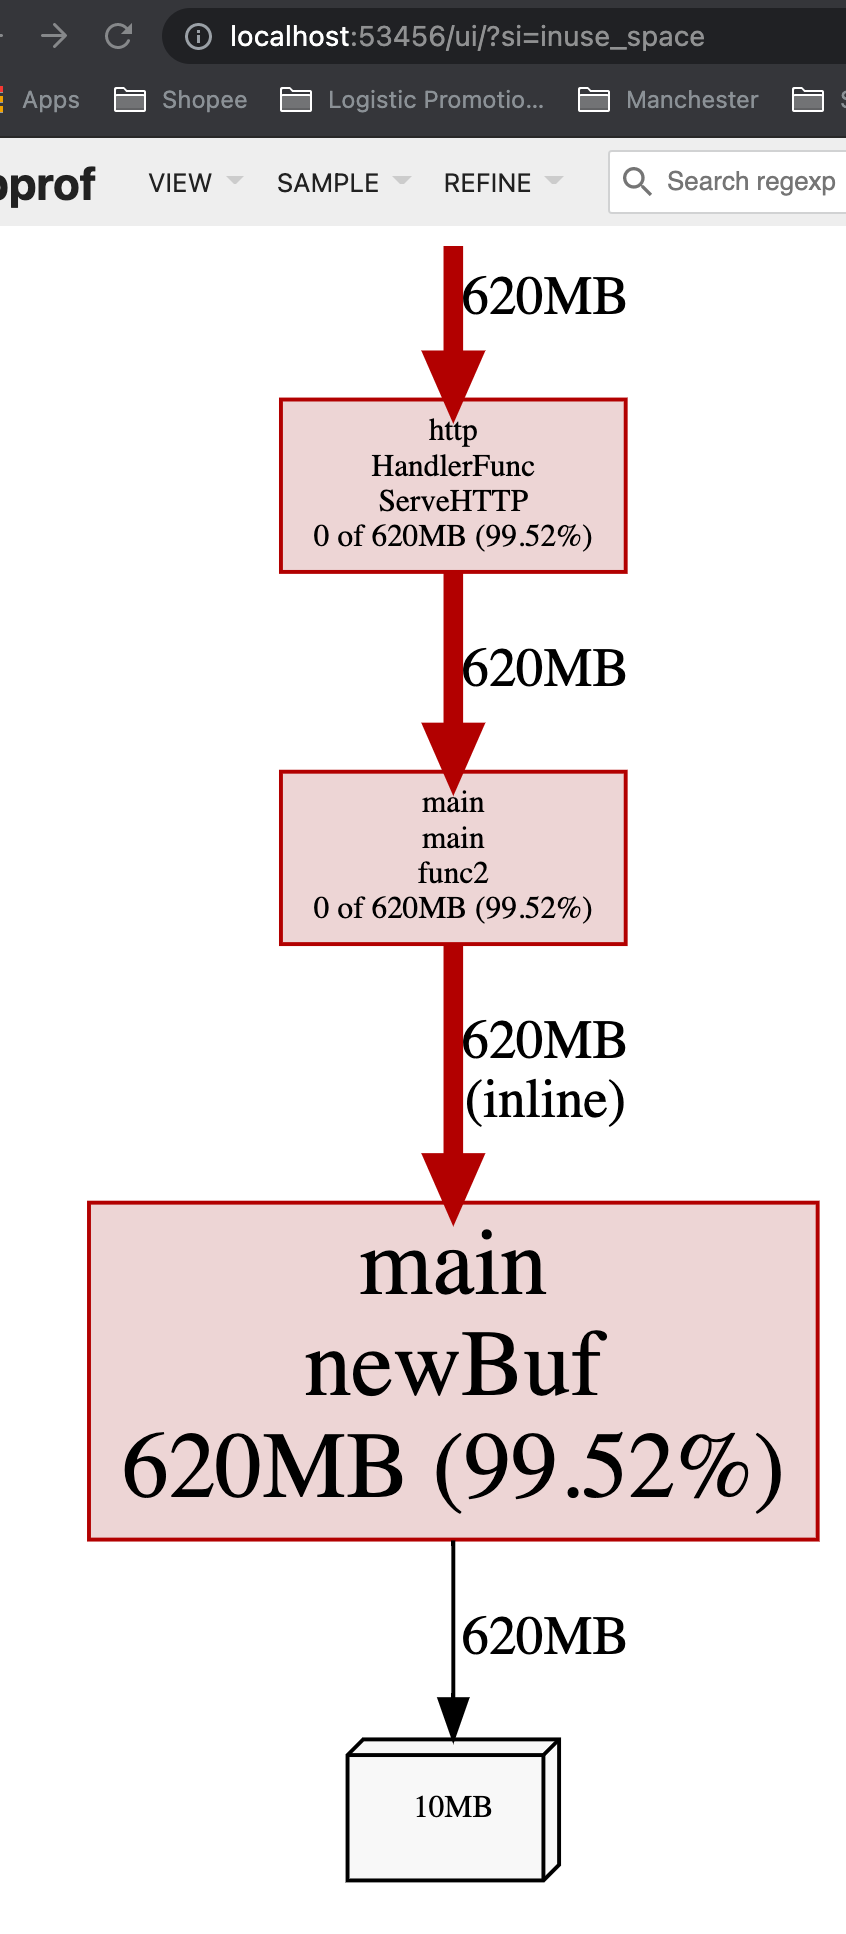
而在没有request到来的时候,内存占用率就会比较低:

这意味着,如果一个app随着throuput/QPS提高时,内存占用率大幅度提升,可能需要考虑减少每个request的内存创建,比如通过考虑object pool。
在我们这个case中,可见 newBuf 产生的申请的内存过多,现在我们使用 sync.Pool 来复用 newBuf 所产生的对象。
改进 - sync.Pool
package main

import (
	"fmt"
	"net/http"
	_ "net/http/pprof"
	"sync"
)

// 使用 sync.Pool 复用需要的 buf
var bufPool = sync.Pool{
	New: func() interface{} {
		return make([]byte, 10<<20)
	},
}

func main() {
	go func() {
		http.ListenAndServe("localhost:6060", nil)
	}()
	http.HandleFunc("/example2", func(w http.ResponseWriter, r *http.Request) {
		b := bufPool.Get().([]byte)
		for idx := range b {
			b[idx] = 0
		}
		fmt.Fprintf(w, "done, %v", r.URL.Path[1:])
		bufPool.Put(b)
	})
	http.ListenAndServe(":8080", nil)
}
$ ab -k -n 5000 -c 100 http://127.0.0.1:8080/example2
...
Requests per second:    1063.66 [#/sec] (mean)
Time per request:       94.015 [ms] (mean)
Time per request:       0.940 [ms] (mean, across all concurrent requests)
Transfer rate:          161.00 [Kbytes/sec] received

Connection Times (ms)
              min  mean[+/-sd] median   max
Connect:        0    0   0.3      0       3
Processing:     1   93 118.9     81    1681
Waiting:        1   93 118.9     80    1681
Total:          1   93 119.0     81    1681

...
可以看到,throughput 从 504.61 提高到了 1063.66,原因是因为更低频率的GC操作和花销更低的GC操作。实际上,在我们做trace的这5s中,并没有发生任何GC操作。
Demo 3 - 查看 GC 活动
频繁进行空间申请和回收的代码:
package main

import (
	"log"
	"net/http"
	_ "net/http/pprof"
	"os"
	"runtime"
)

const (
	KB = 1024
	MB = 1024 * KB
	GB = 1024 * MB
)

func main() {
	log.SetFlags(log.Lshortfile | log.LstdFlags)
	log.SetOutput(os.Stdout)

	runtime.GOMAXPROCS(1)
	runtime.SetMutexProfileFraction(1)
	runtime.SetBlockProfileRate(1)

	go func() {
		for {
			stupidMemoryUse()
		}
	}()

	http.ListenAndServe("0.0.0.0:6060", nil)
}

func stupidMemoryUse() {
	var buffer [][MB]byte
	max := GB
	for len(buffer)*MB < max {
		buffer = append(buffer, [MB]byte{})
	}
}
使用 GODEBUG=gctrace=1
如果是本地开发环境, 可以利用 GODEBUG=gctrace=1 /path/to/binary 的方式输出 GC 信息,然后用 gcvis 作可视化。
GODEBUG=gctrace=1 会输出如下格式的信息(输出到 stderr):
gc 1 @17.471s 0%: 0.22+4.4+0.19 ms clock, 0.66+0/1.8/10+0.57 ms cpu, 4->4->2 MB, 5 MB goal, 4 P
gctrace: setting gctrace=1 causes the garbage collector to emit a single line to standard
error at each collection, summarizing the amount of memory collected and the
length of the pause. The format of this line is subject to change.
Currently, it is:
	gc # @#s #%: #+#+# ms clock, #+#/#/#+# ms cpu, #->#-># MB, # MB goal, # P
where the fields are as follows:
	gc #        the GC number, incremented at each GC
	@#s         time in seconds since program start
	#%          percentage of time spent in GC since program start
	#+...+#     wall-clock/CPU times for the phases of the GC
	#->#-># MB  heap size at GC start, at GC end, and live heap
	# MB goal   goal heap size
	# P         number of processors used
from https://godoc.org/runtime .
为了方便对应上字段,我简单标记了一下:

GODEBUG=gctrace=1 对应的实现在 src/runtime/mheap.go (go 1.6)。
gcvis 的原理很简单, 就是逐行解析目标程序的 GC 输出,然后用正则匹配相关的数据,然后生成 JSON 数据,另外也会起一个协程开启 HTTP 服务,用于图表展示。
gcvis 主要有两种用法:
- 直接运行
gcvis /path/to/binary
- 管道重定向方式(standard error)
GODEBUG=gctrace=1 /path/to/binary |& gcvis
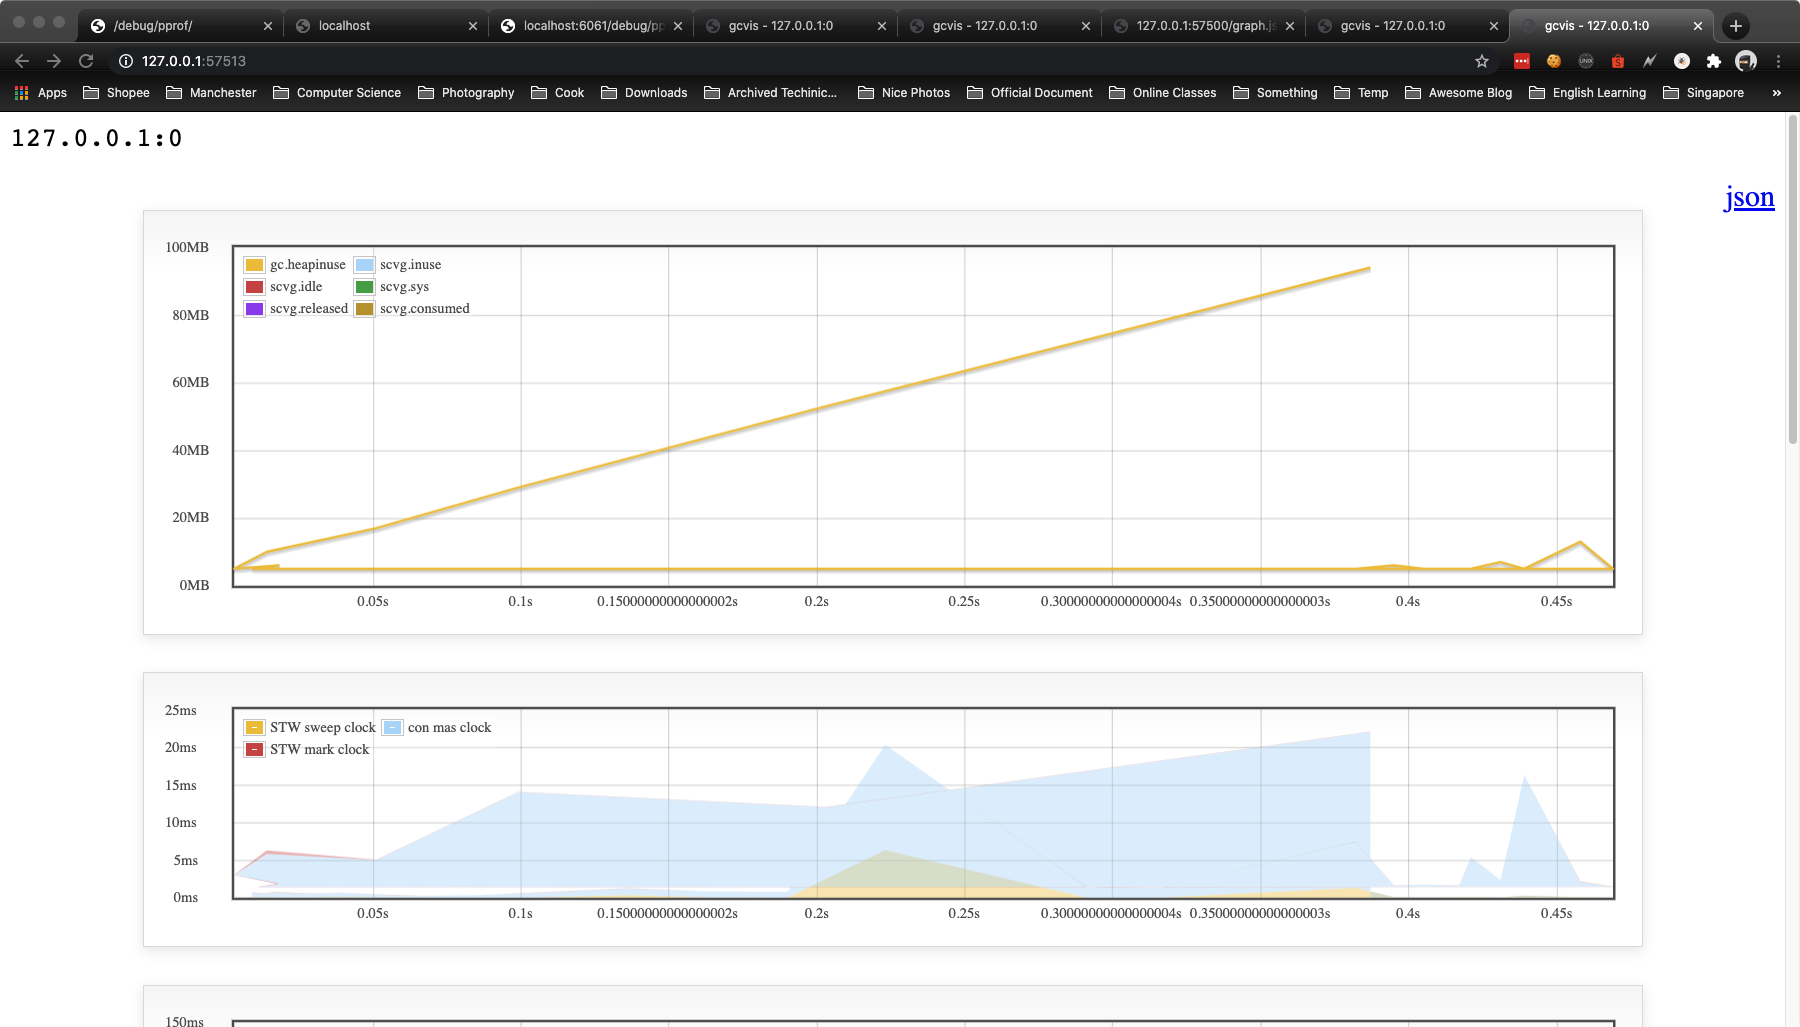
gcvis 的图标输出效果如下:
Installation
# install gcvis
$ go get -u -v github.com/davecheney/gcvis
不使用 gcvis
$ GODEBUG=gctrace=1 go run sw_pprof.go 1>/dev/null 2>&1 grep gc
gc 27 @2.568s 0%: 0.002+438+0.004 ms clock, 0.002+0/0.32/0+0.004 ms cpu, 1536->1536->0 MB, 1537 MB goal, 1 P
scvg: inuse: 512, idle: 2622, sys: 3135, released: 1598, consumed: 1536 (MB)
gc 28 @3.009s 0%: 0.021+0.97+0.009 ms clock, 0.021+0.23/0/0+0.009 ms cpu, 7->7->4 MB, 8 MB goal, 1 P
gc 29 @3.012s 0%: 0.024+1.9+0.003 ms clock, 0.024+0.30/0/0+0.003 ms cpu, 12->12->8 MB, 13 MB goal, 1 P
gc 30 @3.016s 0%: 0.025+4.7+0.005 ms clock, 0.025+0.31/0/0+0.005 ms cpu, 24->24->16 MB, 25 MB goal, 1 P
gc 31 @3.027s 0%: 0.022+7.6+0.003 ms clock, 0.022+0/0.38/0+0.003 ms cpu, 48->48->32 MB, 49 MB goal, 1 P
scvg: inuse: 48, idle: 3086, sys: 3135, released: 1598, consumed: 1536 (MB)
gc 32 @3.046s 0%: 0.050+15+0.003 ms clock, 0.050+0/0.29/0+0.003 ms cpu, 96->96->64 MB, 97 MB goal, 1 P
scvg: inuse: 96, idle: 3038, sys: 3135, released: 1598, consumed: 1536 (MB)
scvg: inuse: 192, idle: 2942, sys: 3135, released: 1598, consumed: 1536 (MB)
gc 33 @3.080s 0%: 0.019+21+0.002 ms clock, 0.019+0/0.19/0+0.002 ms cpu, 192->192->128 MB, 193 MB goal, 1 P
scvg: inuse: 192, idle: 2942, sys: 3135, released: 1598, consumed: 1536 (MB)
scvg: inuse: 384, idle: 2750, sys: 3135, released: 1599, consumed: 1536 (MB)
gc 34 @3.136s 0%: 0.023+43+0.003 ms clock, 0.023+0/0.21/0+0.003 ms cpu, 384->384->256 MB, 385 MB goal, 1 P
scvg: inuse: 384, idle: 2750, sys: 3135, released: 1599, consumed: 1536 (MB)
可以看到,这里对内存空间的申请与释放非常频繁。
使用 gcvis
$ GODEBUG=gctrace=1 go run sw_pprof.go |& gcvis
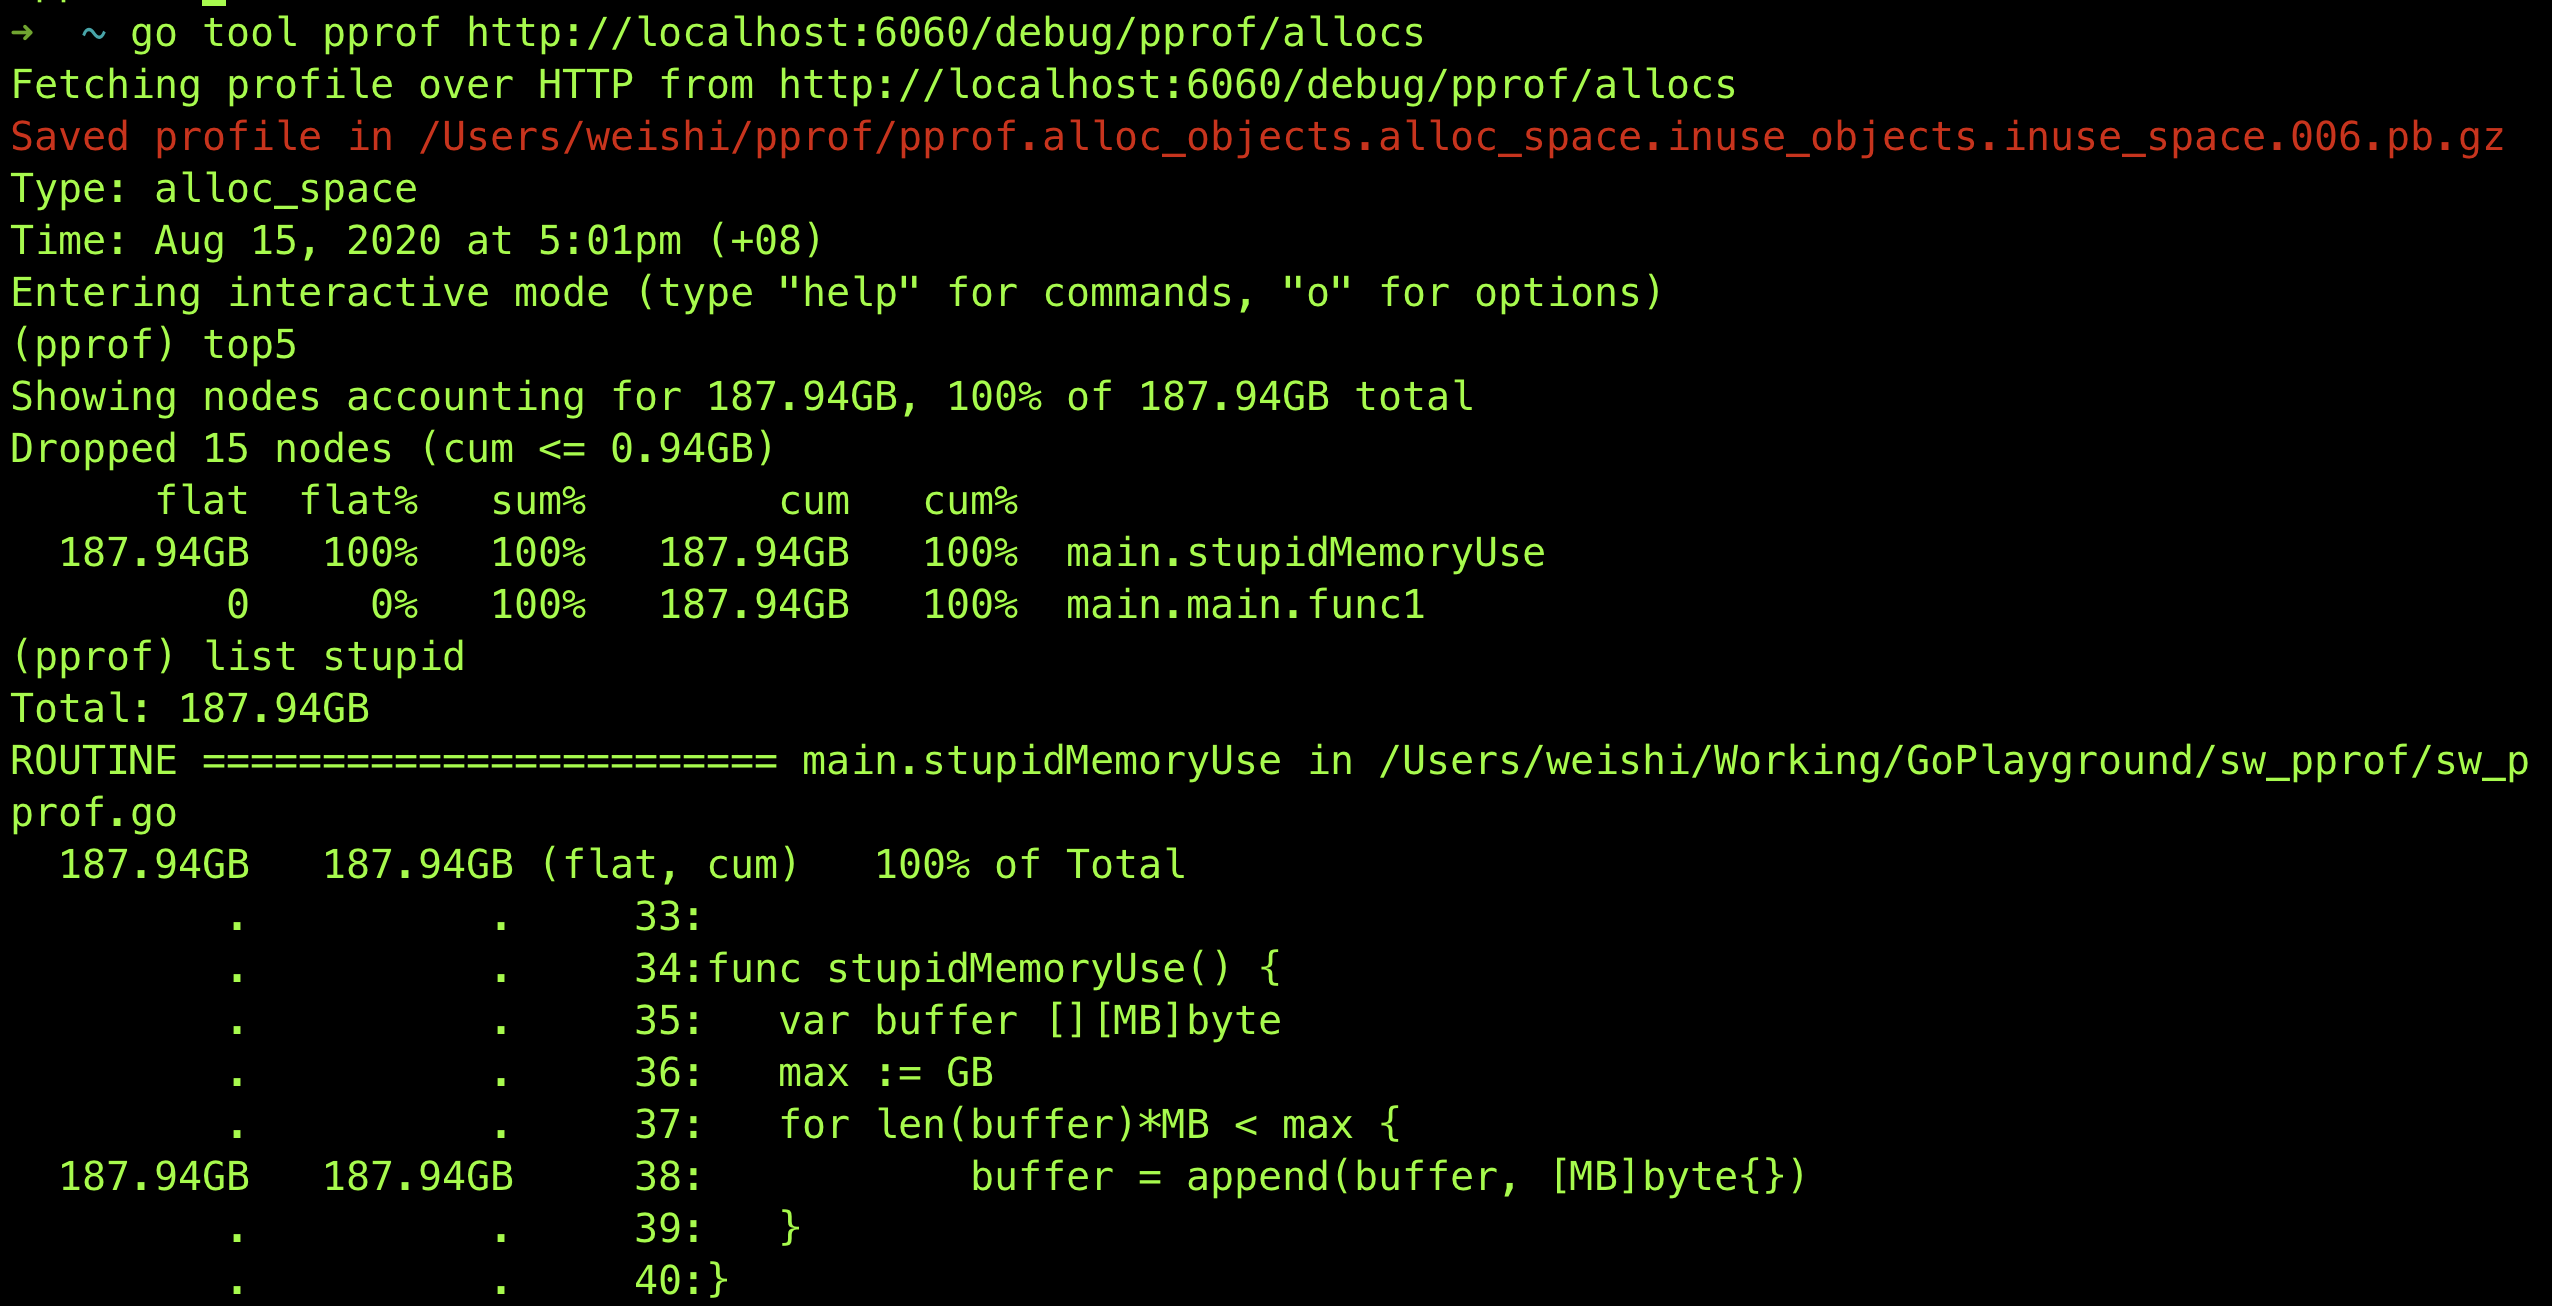
使用 pprof
那我们来用pprof分析一下:
如果我们改成这样:
func stupidMemoryUse() {
	_ = make([]byte, 5*KB)
}
重新编译运行,会发现并不会引起频繁 GC,原因是在 Golang 里,对象是使用堆内存还是栈内存,由编译器进行逃逸分析并决定,如果对象不会逃逸,便可使用栈内存。
但有意外,就是对象的尺寸过大时,就还是只能使用堆内存了。
所以这里设置申请较多的空间,就是为了避免编译器直接在栈上分配(因为,如果那样,就不会涉及到 GC 了)。
Reference
- https://godoc.org/runtime
- https://dave.cheney.net/2014/07/11/visualising-the-go-garbage-collector
- http://holys.im/2016/07/01/monitor-golang-gc/