What is Distributed Tracing?
Distributed tracing, also called distributed request tracing, is a method used to profile and monitor applications, especially those built using a microservices architecture. Distributed tracing helps pinpoint where failures occur and what causes poor performance.
What is a Trace and a Span?
About tracing system, it is designed for understanding system behavior and reasoning about performance issues, which is invaluable especially nowadays the Internet services are often implemented as complex, large-scale distributed systems. In such systems, if we consider the process from receiving the request to completing the processing of the response as a transaction, understanding system behavior in one transaction requires observing related activities across many different programs and machines.
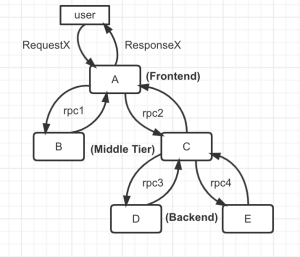
Therefore, we need to abstract some concepts to carry and propagate these cross-program information and then combine them to represent this transaction. For example, if a service with 5 servers: a front-end (A), two middletiers (B and C) and two backends (D and E). When a user request (the initiator in this case) arrives at the front end, it sends two RPCs to servers B and C. B can respond right away, but C requires work from backends D and E before it can reply to A, which in turn responds to the originating request. The process would be like this:
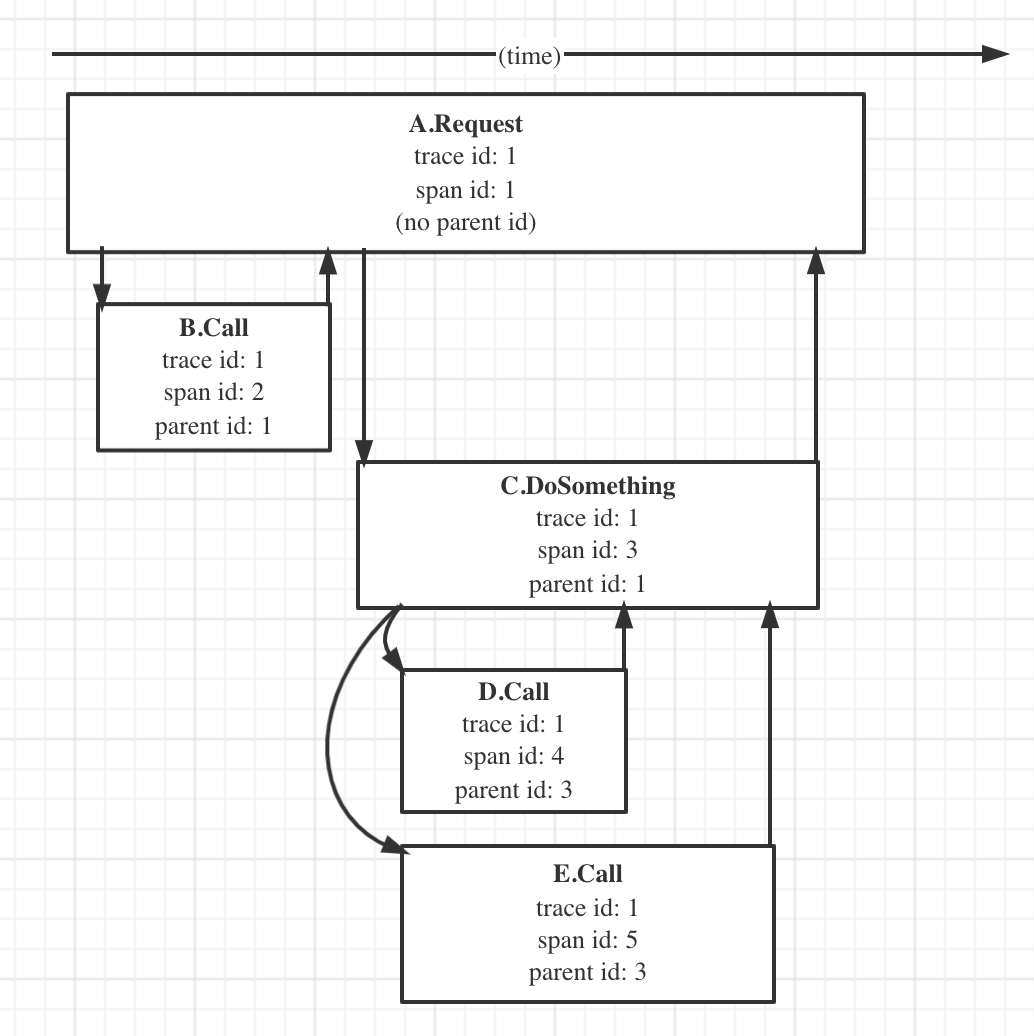
In the tracing system, this process would be abstracted as the below image. Each “square” in the figure represents a Span, the string value like “A.Request” is the operation name of the Span and the length of the “square” represents the time cost by this operation. These spans form a larger structure, called Trace which represents an end-to-end request that moves through a distributed system. In addition, how to combine the spans to a trace needs SpanContext, which includes trace id, span id and parent id.
In order to represent activities across many different programs and machines, we need to carry and propagate SpanContext in every cross-program request. In addition to the SpanContext, there are also some common data need to be propagated, we called it Baggage. Depending on the transport protocol, the information in the SpanContext and Baggage can be propagated along with HTTP header or TCP header.
So far, we have given a general description of the abstract concepts introduced in the tracing system. Next, there are some terms explanation and the workflow of integrating tracing.
Terms
-
Trace
- A Trace represents a call-chain.
- Traces are defined implicitly by their Spans. In particular, a Trace can be thought of as a directed acyclic graph (DAG) of Spans, where the edges between Spans are called References.
- Trace ID: The distributed tracing system assigns a unique ID to every request in order to track it. Each span inherits the same trace ID from the original request it belongs to. Spans are also tagged with a unique span ID that helps the tracing system consolidate the metadata, logs, and metrics it collects.
-
Span
- A Span represents an RPC call or a procedure within a process.
- Each Span encapsulates the following state:
- An operation name
- A start timestamp
- A finish timestamp
- A set of zero or more key:value Span Tags. The keys must be strings. The values may be strings, bools, or numeric types.
- A set of zero or more Span Logs, each of which is itself a key:value map paired with a timestamp. The keys must be strings, though the values may be of any type. We only use this in debug mode.
- A SpanContext (see below)
- References to zero or more causally-related Spans (via the SpanContext of those related Spans)
-
SpanContext
- SpanContext encapsulates the state (such as trace id, sample flag, and span ids) needed to refer to a distinct Span across a process boundary. Propagating those states across processes is necessary so that individual processes can construct a DAG together in a distributed environment. SpanContext could be encoded as an opaque string and be propagated between services via the RPC header.
-
Reference
-
There are two types of references: ChildOf and FollowsFrom, we only support ChildOf now.
ChildOf references: A Span may be the ChildOf a parent Span. In a ChildOf reference, the parent Span depends on the child Span in some capacity. All of the following would constitute ChildOf relationships:
- A Span representing the server-side of an RPC may be the ChildOf a Span representing the client-side of that RPC
- A Span representing a SQL insert may be the ChildOf a Span representing an ORM save method
- Many Spans doing concurrent (perhaps distributed) work may all individually be the ChildOf a single parent Span that merges the results for all children that return within a deadline
-
For example, the following is an example Trace made up of 8 Spans:
Causal relationships between Spans in a single Trace


        [Span A]  ←←←(the root span)
            |
     +------+------+
     |             |
 [Span B]      [Span C] ←←←(Span C is a `ChildOf` Span A)
     |             |
 [Span D]      +---+-------+
               |           |
           [Span E]    [Span F] >>> [Span G] >>> [Span H]
                                       ↑
                                       ↑
                                       ↑
                         (Span G `FollowsFrom` Span F)
Sometimes it’s easier to visualize Traces with a time axis as in the diagram below:
Temporal relationships between Spans in a single Trace


––|–––––––|–––––––|–––––––|–––––––|–––––––|–––––––|–––––––|–> time

 [Span A···················································]
   [Span B··············································]
      [Span D··········································]
    [Span C········································]
         [Span E·······]        [Span F··] [Span G··] [Span H··]
Starting a new Trace
A new trace is started whenever a new Span is created without references to a parent Span. When creating a new Span, you need to specify an “operation name”, which is a free-format string that you can use to help you identify the code this Span relates to.
The next Span from our new trace will probably be a child Span and can be seen as a representation of a sub-routine that is executed “within” the main Span. This child Span has, therefore, a ChildOf relationship with the parent.
Another type of relationship is the FollowsFrom and is used in special cases where the new Span is independent of the parent Span, such as in asynchronous processes.
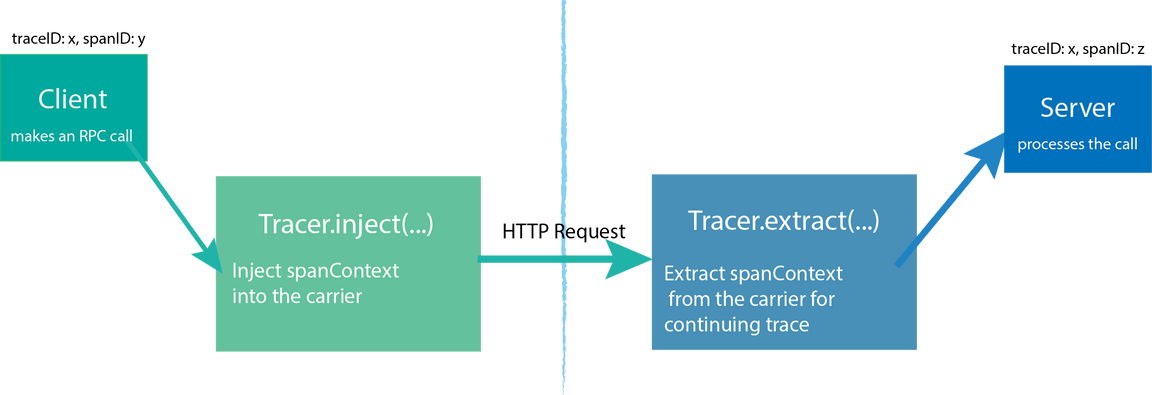
Propagating a Trace with Inject/Extract
In order to trace across process boundaries in distributed systems, services need to be able to continue the trace injected by the client that sent each request.
OpenTracing allows this to happen by providing inject and extract methods that encode a span’s context into a carrier. The inject method allows for the SpanContext to be passed on to a carrier. For example, passing the trace information into the client’s request so that the server you send it to can continue the trace. The extract method does the exact opposite. It extracts the SpanContext from the carrier. For example, if there was an active request on the client side, the developer must extract the SpanContext using the io.opentracing.Tracer.extract method.
Distributed Tracing Standards
-
- the next major version of both OpenCensus and OpenTracing supported by the Cloud Native Computing Foundation (CNCF)
- OpenTelemetry unifies OpenTracing and OpenCensus. It combines the best features of both standards to provide a comprehensive distributed tracing framework. OpenTelemetry provides extensive software development kits, APIs, libraries, and other instrumentation tools for implementing distributed tracing more effortlessly.
-
- OpenTracing is an open source distributed tracing standard developed by the Cloud Native Computing Foundation (CNCF). OpenTracing focuses on enabling developers to generate traces with an instrumentation API. This allows developers to generate distributed traces from different parts of the code base, library, or other dependencies.
-
- OpenCensus consists of multi-language libraries capable of extracting software metrics and sending them to backend systems for analysis. Developers can use the provided API to manage how traces are generated and collected. Unlike OpenTracing, developers work with OpenCensus from a single project repository instead of individual code bases and libraries.
Reference
- “Dapper, a Large-Scale Distributed Systems Tracing Infrastructure”
- https://peter.bourgon.org/blog/2017/02/21/metrics-tracing-and-logging.html
- https://opentracing.io/docs/overview/what-is-tracing/
- https://eng.uber.com/distributed-tracing/
- https://microservices.io/patterns/observability/distributed-tracing.html
- https://confluence.shopee.io/display/SPDEV/%5BTracing%5DIntroduction
- https://confluence.shopee.io/display/SPDEV/%5BTracing%5D+%5BUser+Guide%5D+Preknowledge
- https://tech.meituan.com/2022/07/21/visualized-log-tracing.html
- https://aws.amazon.com/what-is/distributed-tracing