GOGC
The GOGC variable sets the initial garbage collection target percentage. A collection is triggered when the ratio of freshly allocated data to live data remaining after the previous collection reaches this percentage.
Default Value
The default is GOGC=100, which means garbage collection will not be triggered until the heap has grown by 100% since the previous collection. Effectively GOGC=100 (the default) means the garbage collector will run each time the live heap doubles.
- Setting this value higher, say
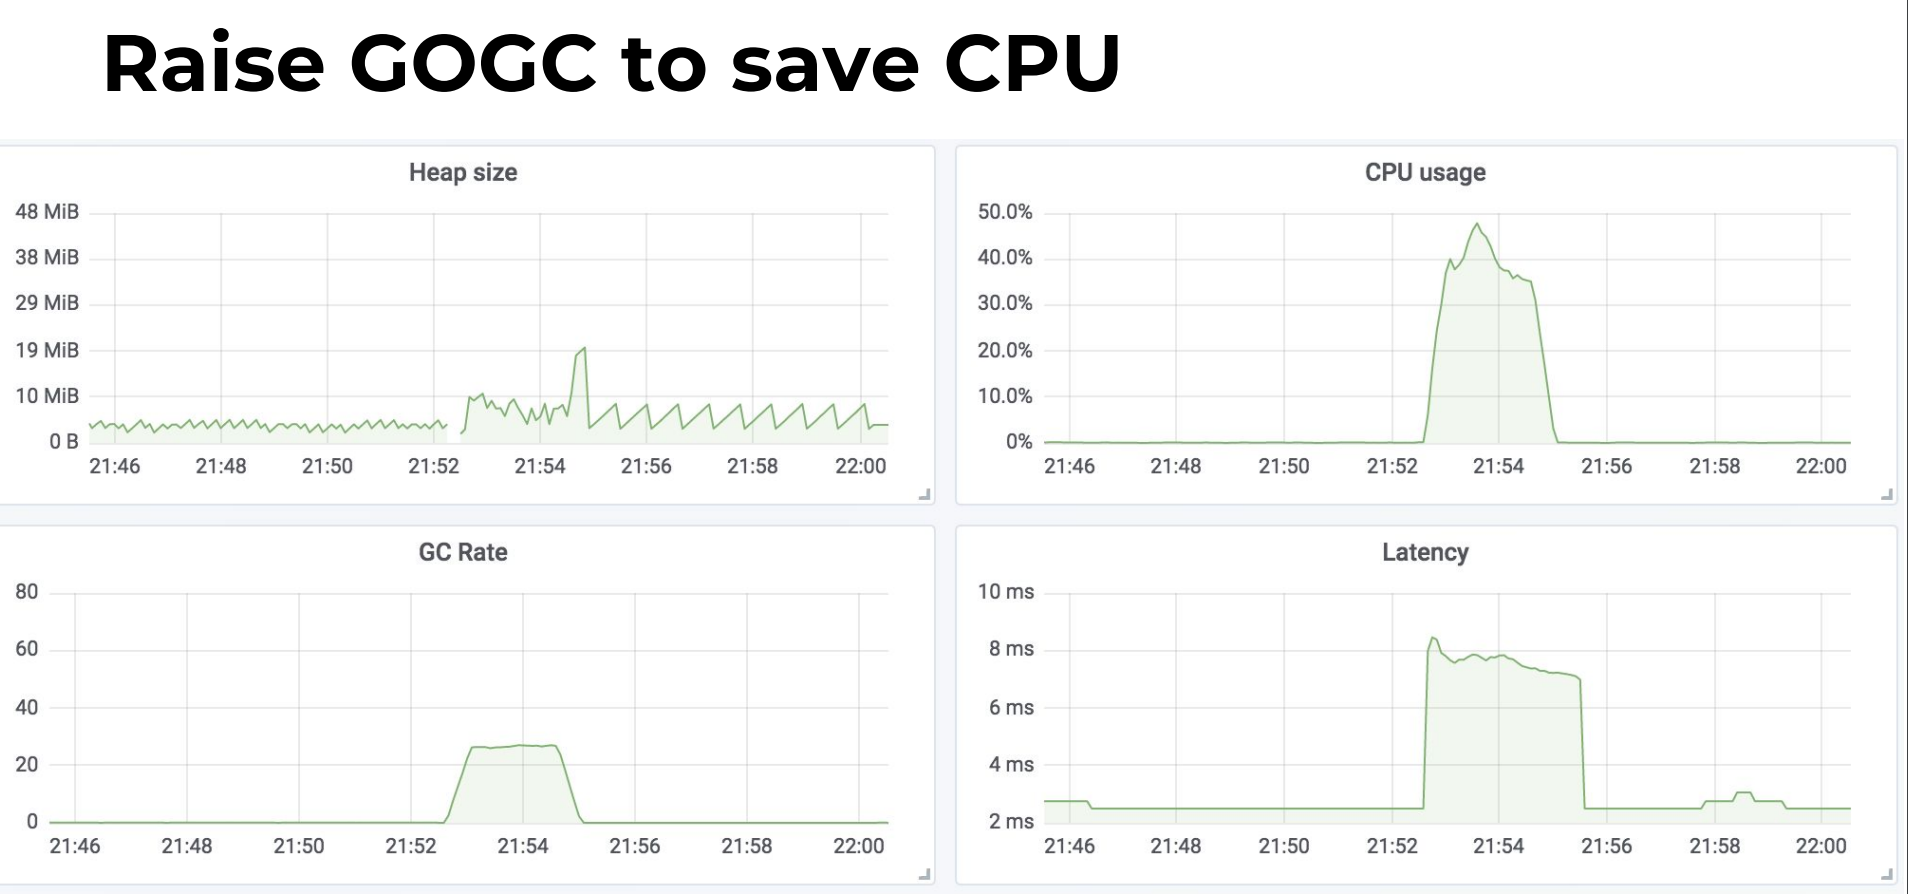
GOGC=200, will delay the start of a garbage collection cycle until the live heap has grown to 200% of the previous size. - Setting the value lower, say
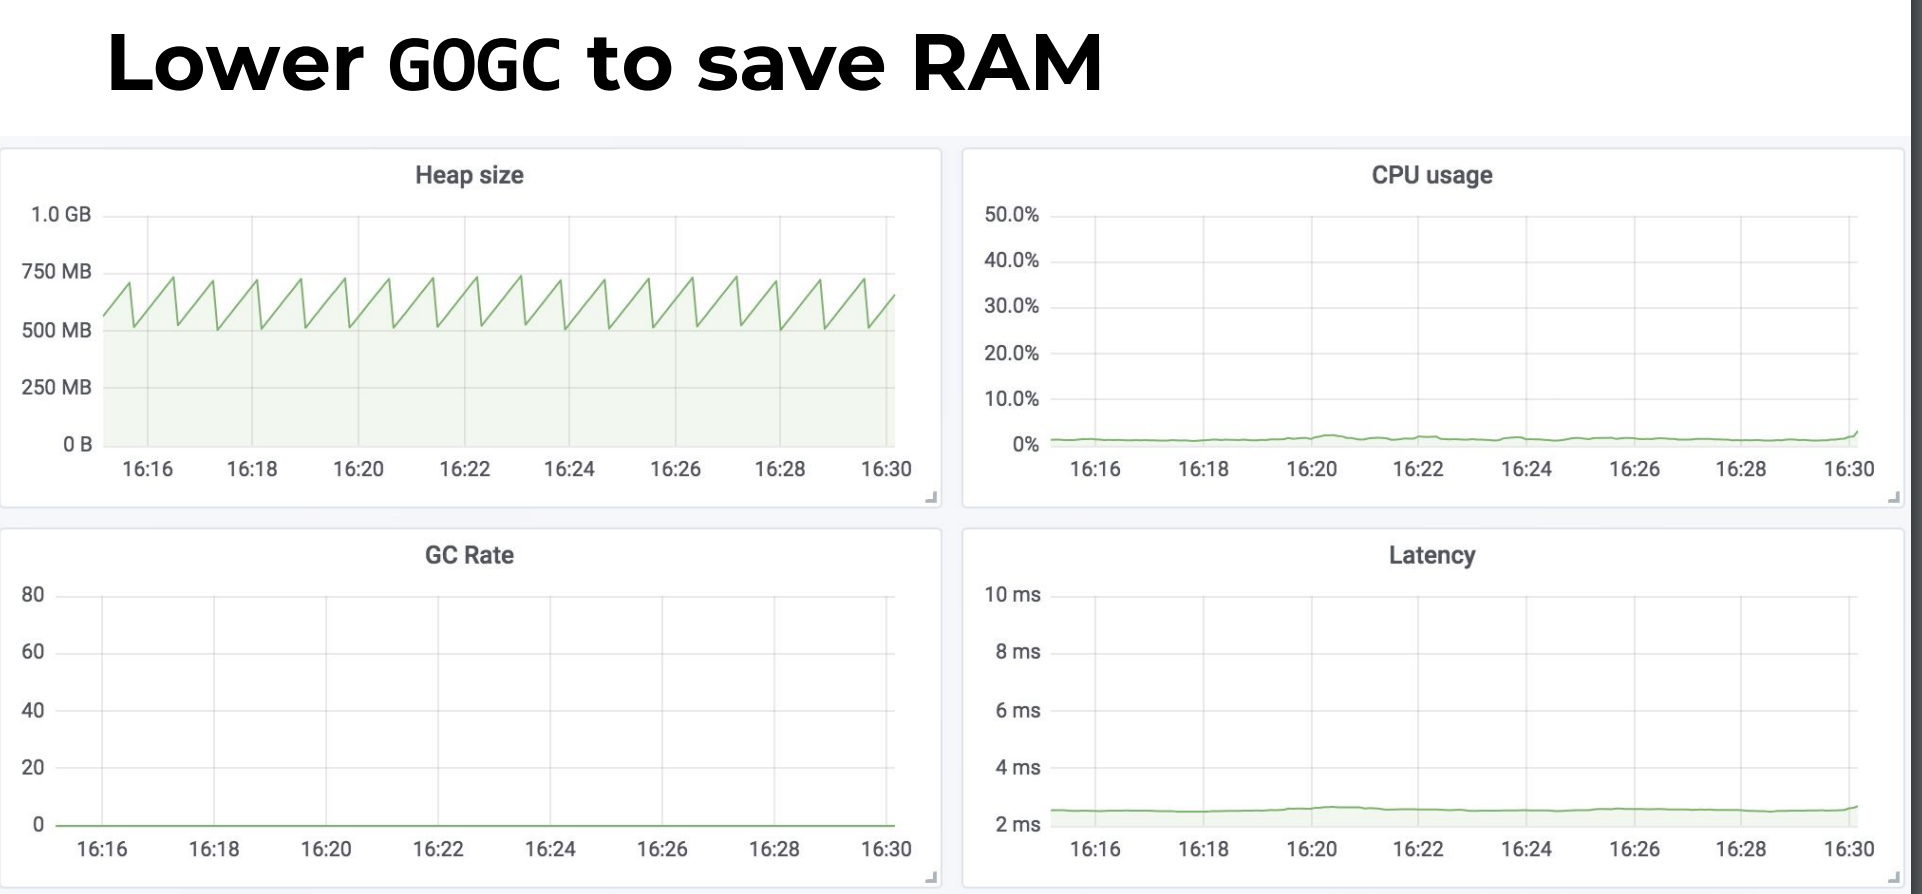
GOGC=20will cause the garbage collector to be triggered more often as less new data can be allocated on the heap before triggering a collection.
Setting GOGC=off disables the garbage collector entirely. The runtime/debug package’s SetGCPercent function allows changing this percentage at run time. See https://golang.org/pkg/runtime/debug/#SetGCPercent.
Tune GOGC
Example
在这个程序中,每当产生一个 /example2的请求时,都会创建一段内存,并用于进行一些后续的工作。
package main

import (
	"fmt"
	"net/http"
	_ "net/http/pprof"
)

func newBuf() []byte {
	return make([]byte, 10<<20)
}
func main() {
	go func() {
		http.ListenAndServe("localhost:6060", nil)
	}()
	http.HandleFunc("/example2", func(w http.ResponseWriter, r *http.Request) {
		b := newBuf()
		// 模拟执行一些工作
		for idx := range b {
			b[idx] = 1
		}
		fmt.Fprintf(w, "done, %v", r.URL.Path[1:])
	})
	http.ListenAndServe(":8080", nil)
}
为了进行性能分析,我们还额外创建了一个监听 6060 端口的 goroutine,用于使用 pprof 进行分析。我们先让服务器跑起来:
$ go run main.go
...
这时候我们使用一个压测工具 ab,来同时产生 5000 个请求(-n 一共 5000 个请求,-c 表示每次执行请求的数量,每次 100 个并发请求):
$ ab -k -n 5000 -c 100 http://127.0.0.1:8080/example2
...
Requests per second: 504.61 [#/sec] (mean)
Time per request: 198.173 [ms] (mean)
Time per request: 1.982 [ms] (mean, across all concurrent requests)
Transfer rate: 76.38 [Kbytes/sec] received
Connection Times (ms)
min mean[+/-sd] median max
Connect: 0 0 2.1 0 21
Processing: 9 197 160.1 125 1134
Waiting: 6 196 160.1 124 1134
Total: 9 197 160.1 125 1134
...
# At the same time
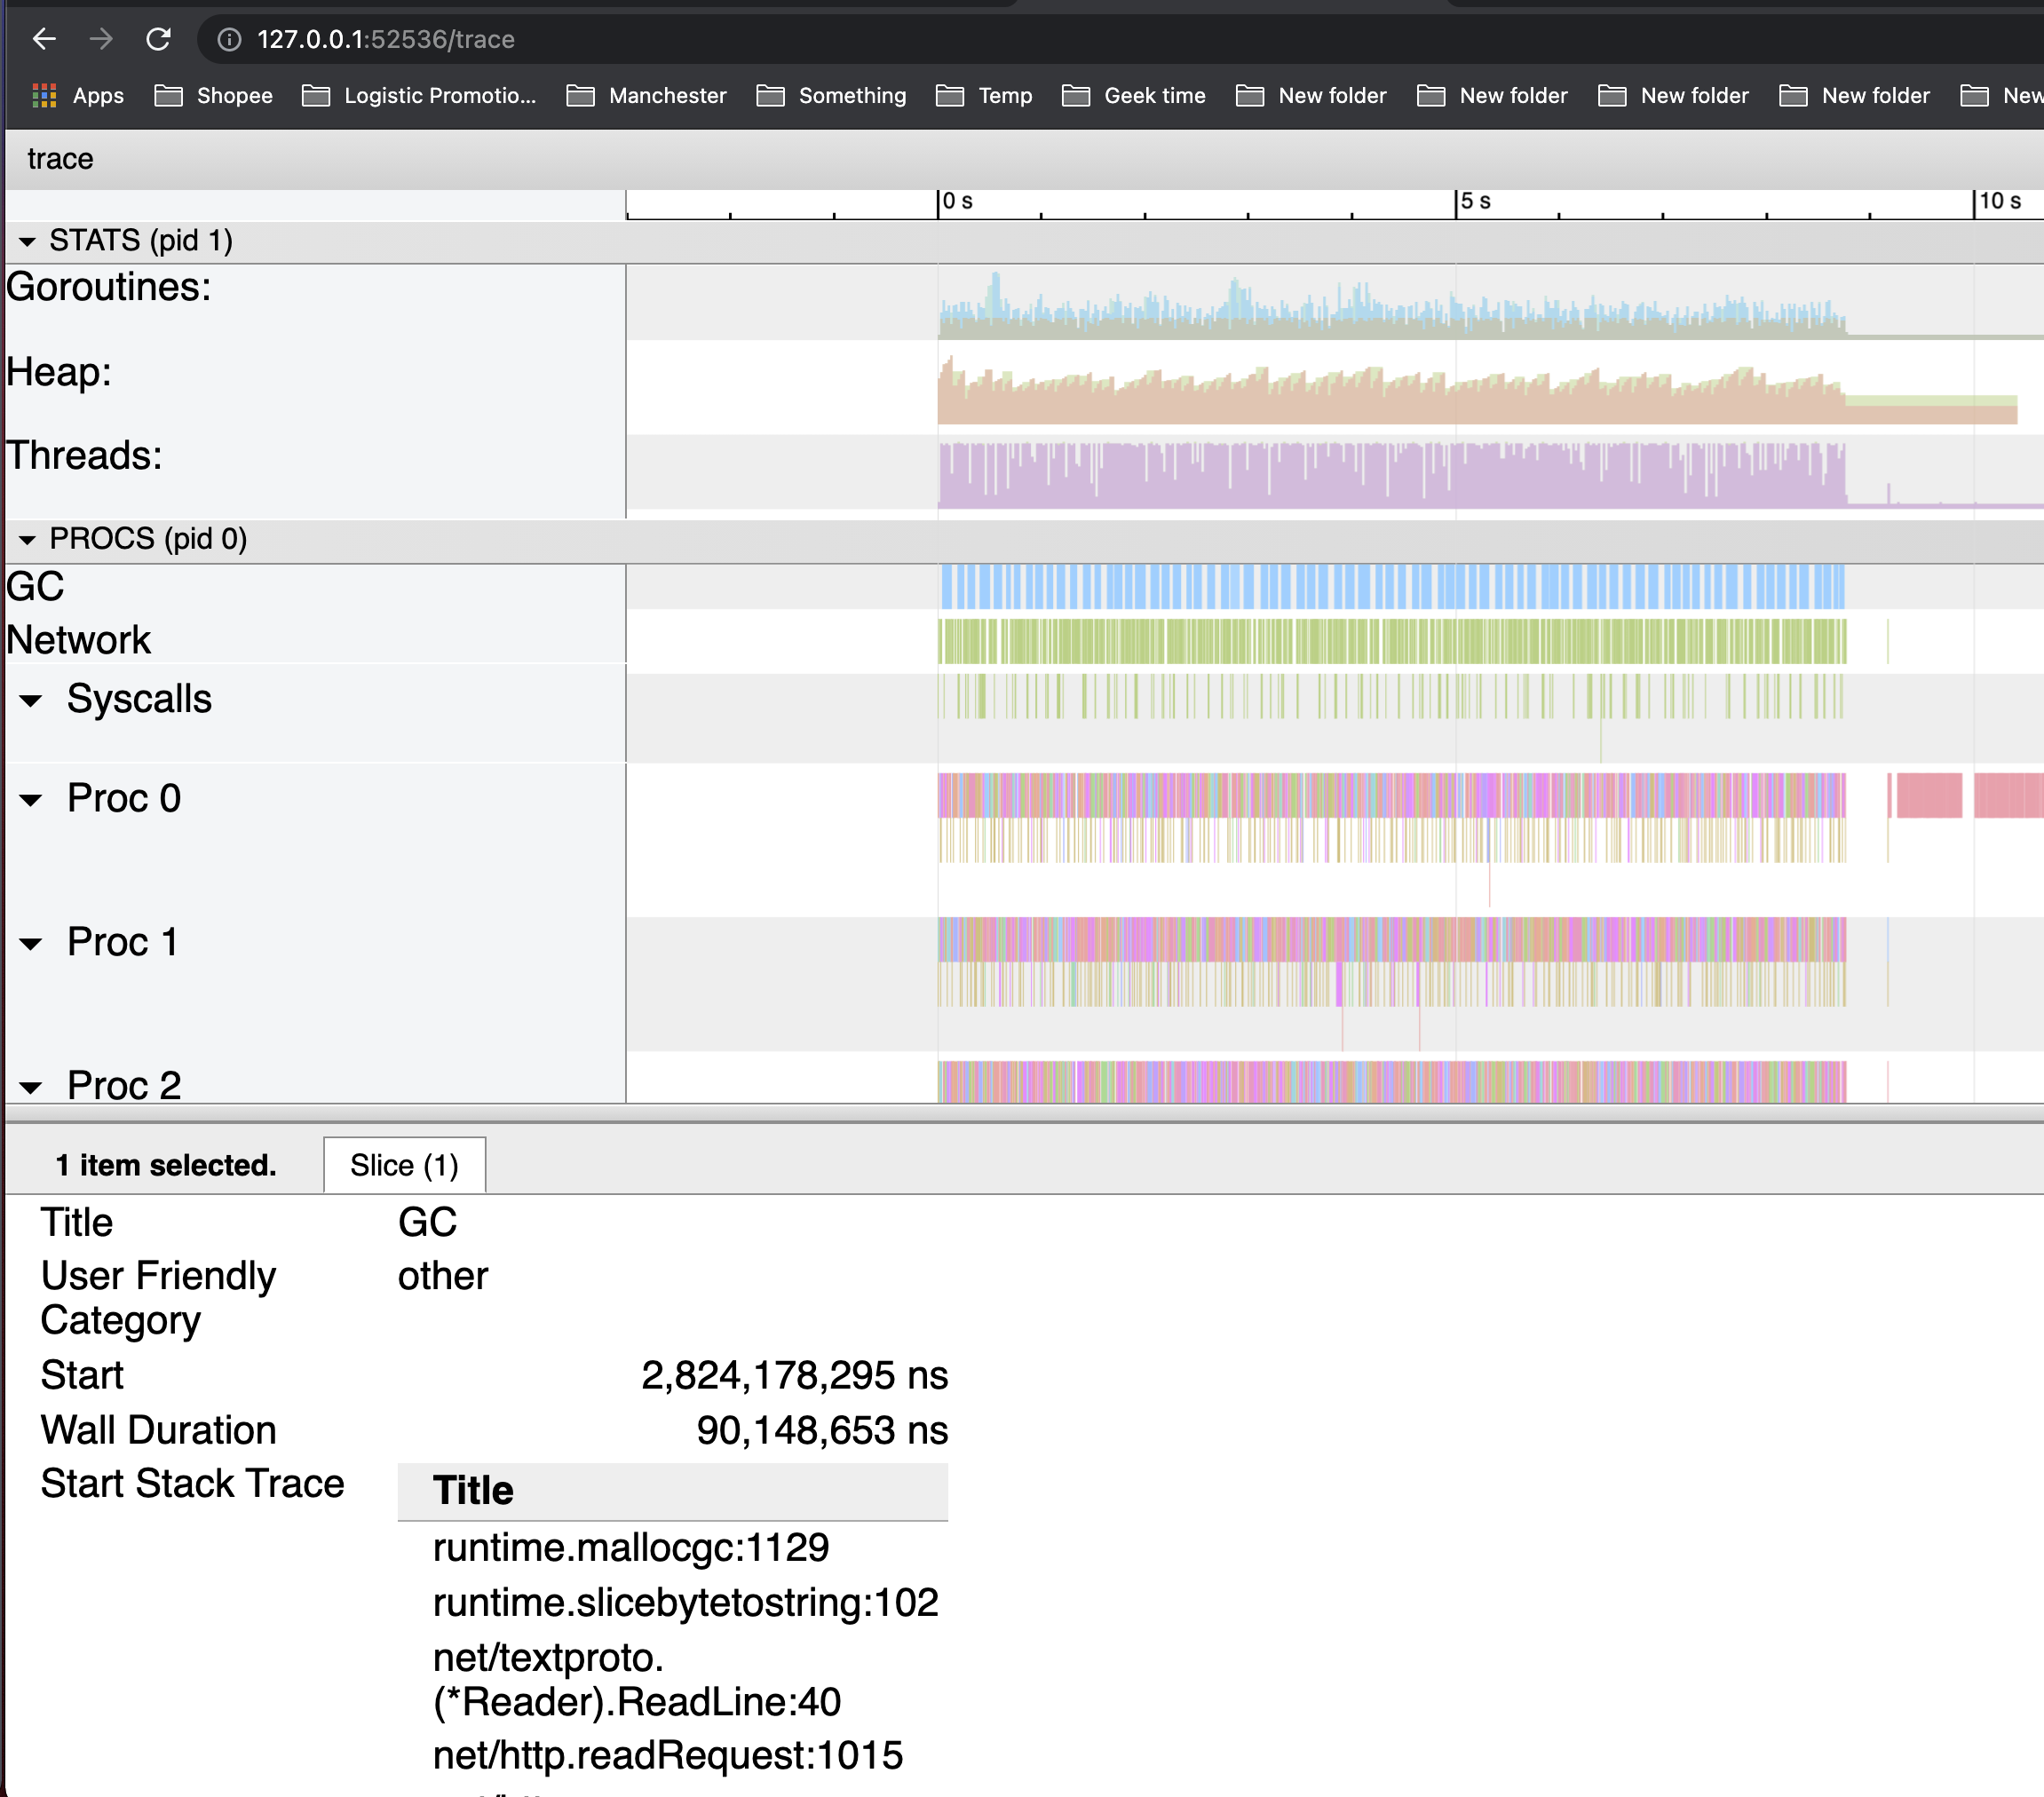
$ wget http://127.0.0.1:6060/debug/pprof/trace\?seconds\=5 -O /tmp/trace.out && go tool trace /tmp/trace.out
可以看到,GC 反复被触发,一个显而易见的原因就是内存分配过多。
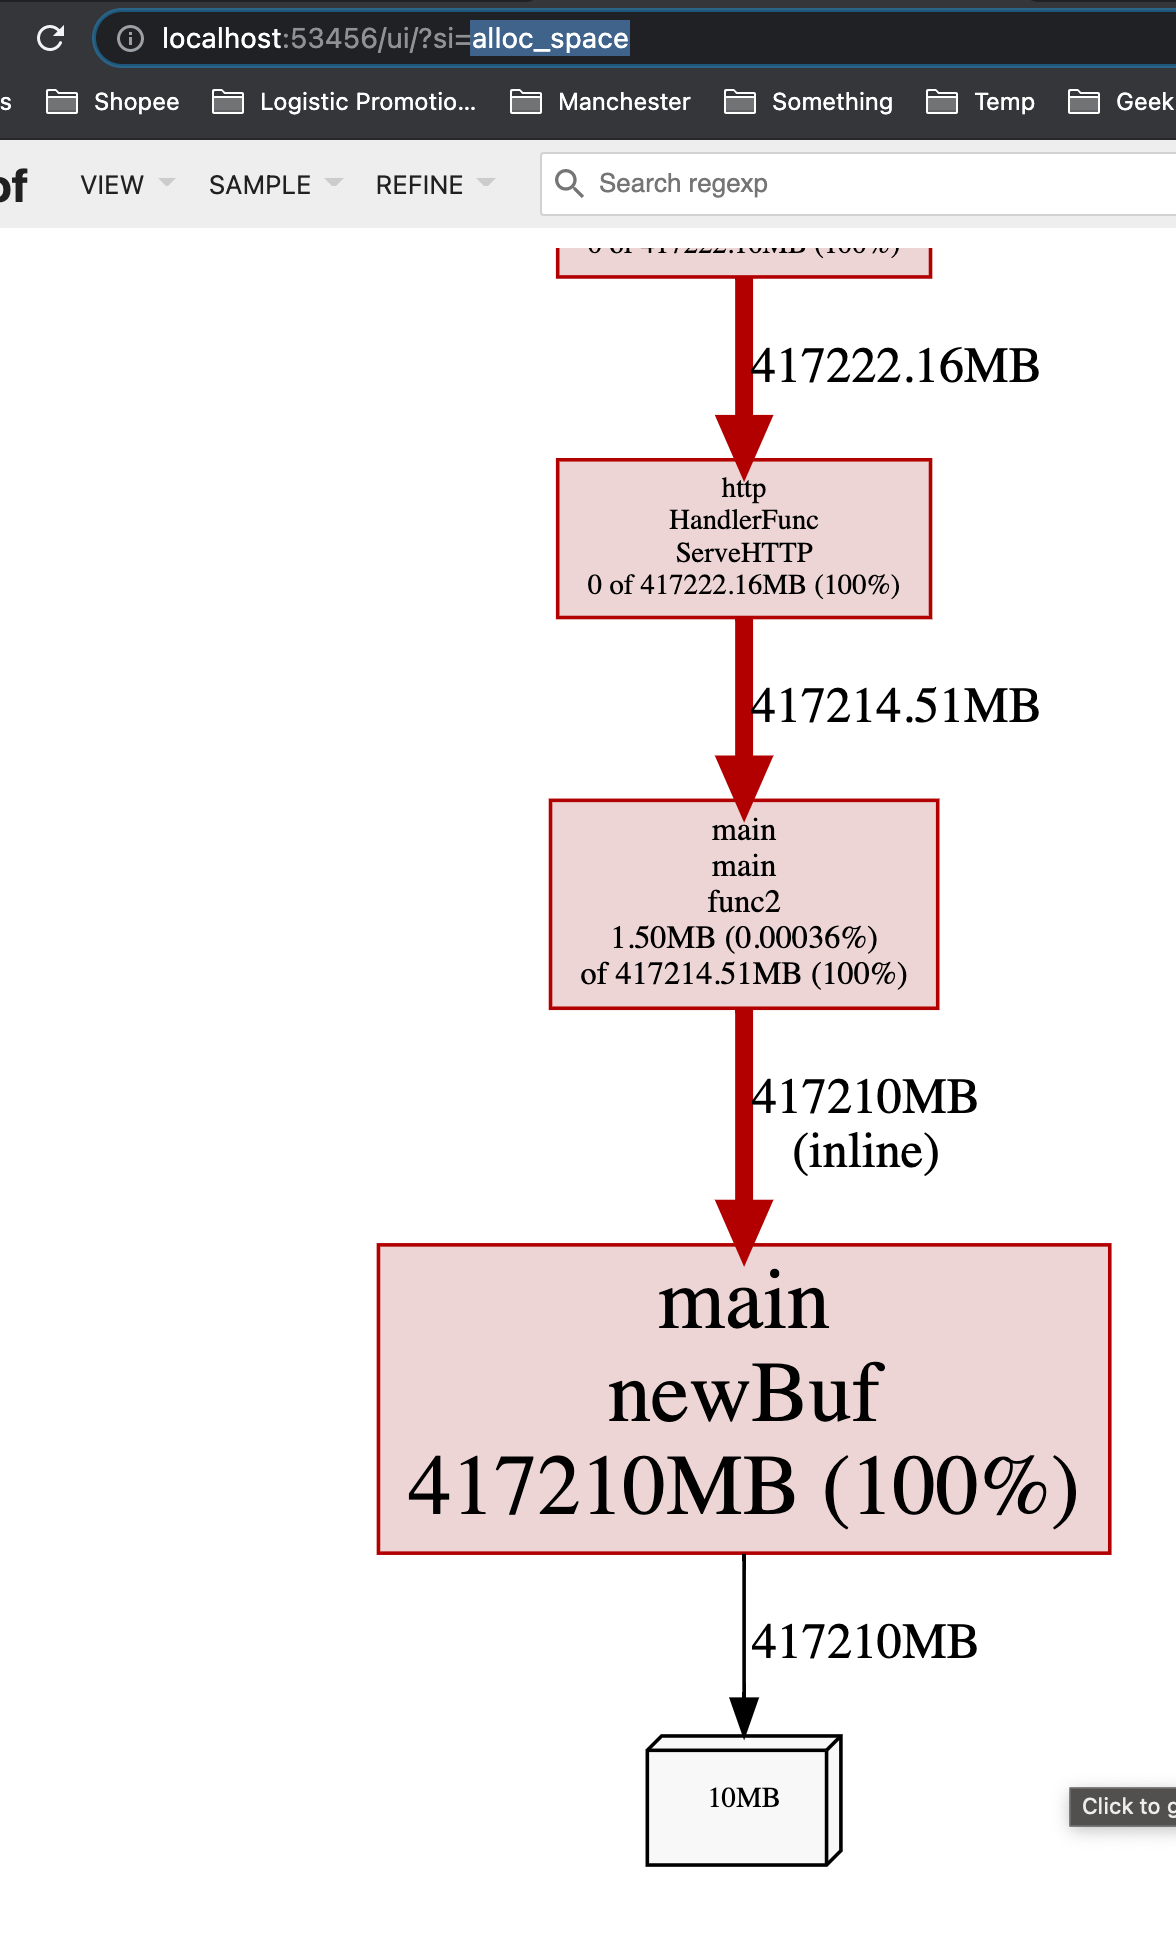
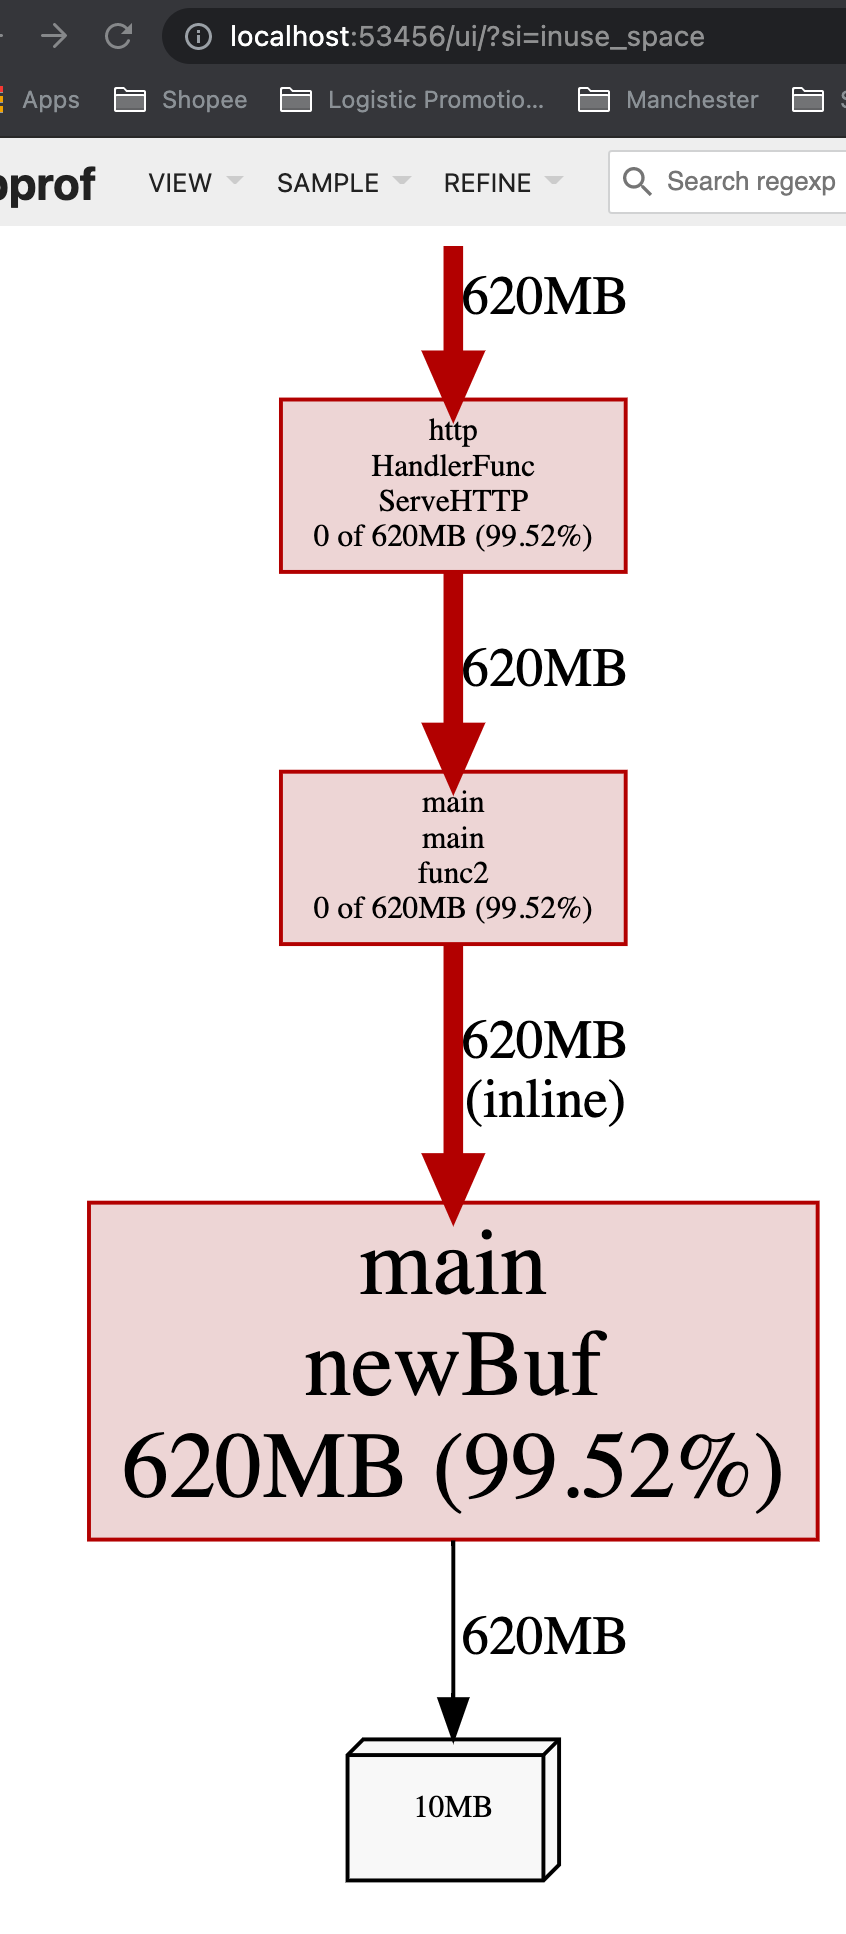
我们可以通过 go tool pprof 来查看究竟是谁分配了大量内存(alloc_space)。
$ go tool pprof -http : http://127.0.0.1:6060/debug/pprof/heap
Fetching profile over HTTP from http://127.0.0.1:6060/debug/pprof/heap
Saved profile in /Users/shiwei/pprof/pprof.alloc_objects.alloc_space.inuse_objects.inuse_space.003.pb.gz
Serving web UI on http://localhost:53456
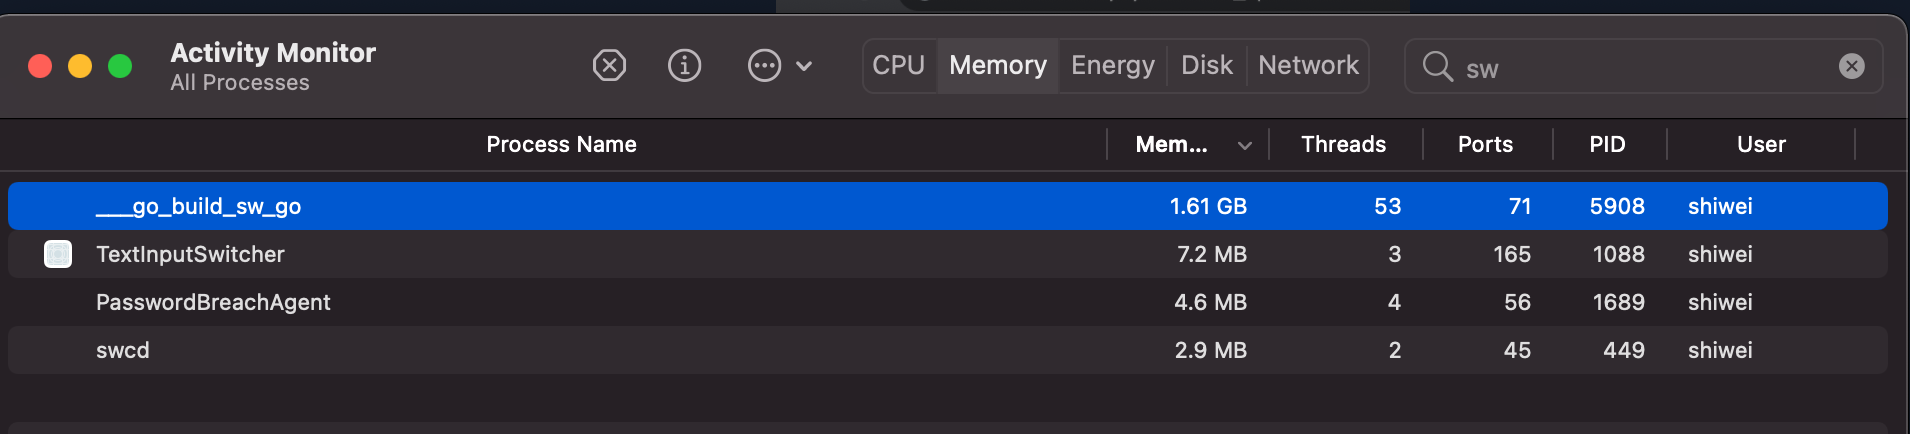
从inuse_space来看也很高,这意味着这个app在运行时,如果一处理request,就会占用很大的内存:
而在没有request到来的时候,内存占用率就会比较低:

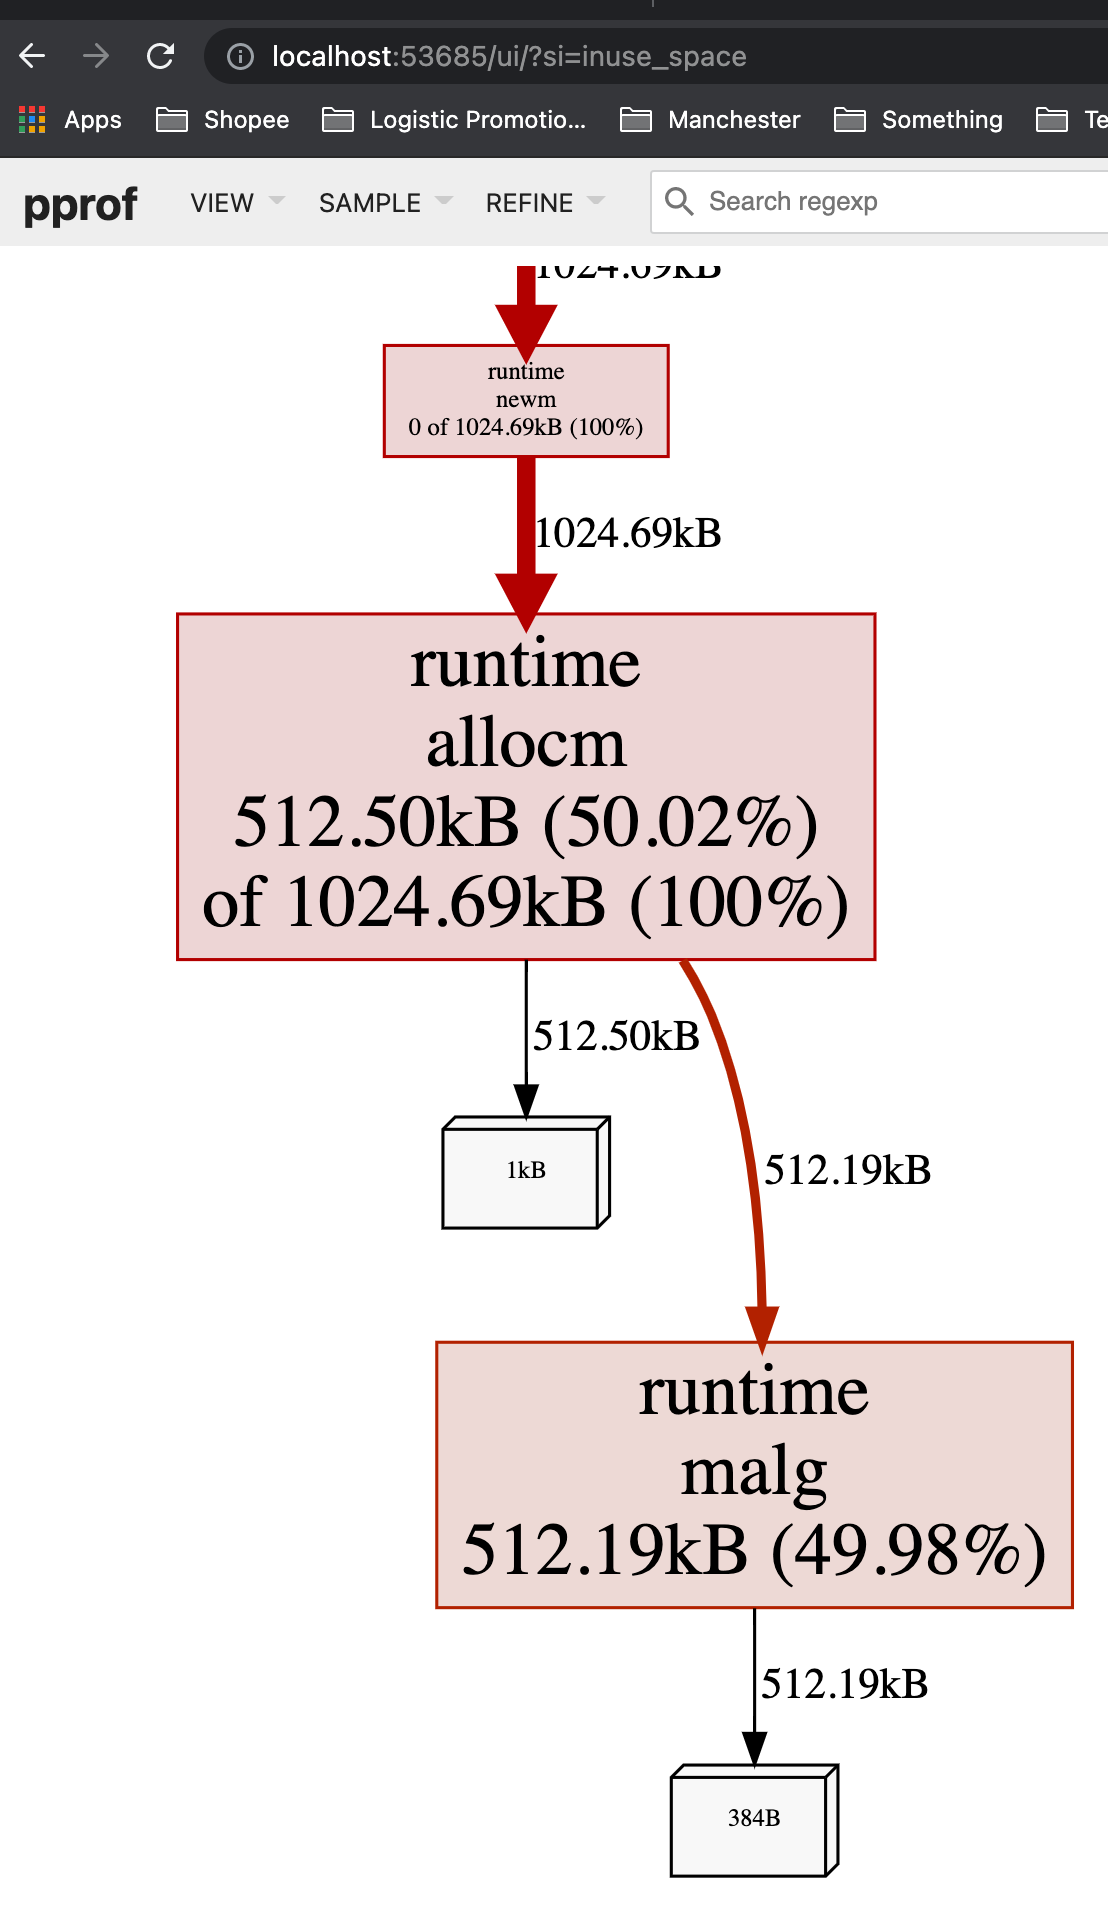
这意味着,如果一个app随着throuput/QPS提高时,内存占用率大幅度提升,可能需要考虑减少每个request的内存创建,比如通过考虑object pool。
在我们这个case中,可见 newBuf 产生的申请的内存过多,现在我们使用 sync.Pool 来复用 newBuf 所产生的对象。
Tune GOGC
我们已经知道了 GC 的触发原则是由步调算法来控制的,其关键在于估计下一次需要触发 GC 时,堆的大小。可想而知,如果我们在遇到海量请求的时,为了避免 GC 频繁触发,是否可以通过将 GOGC 的值设置得更大,让 GC 触发的时间变得更晚,从而减少其触发频率,进而增加用户代码对机器的使用率呢?答案是肯定的。
我们可以非常简单粗暴的将 GOGC 调整为 1000,来执行上一个例子中未复用对象之前的程序:
$ GOGC=1000 ./main
这时我们再重新执行压测:
# GO=1000 下运行 app 并测试
$ ab -k -n 5000 -c 100 http://127.0.0.1:8080/example2 & wget http://127.0.0.1:6060/debug/pprof/trace\?seconds\=5 -O /tmp/trace.out && go tool trace /tmp/trace.out
# GOGC=250 下运行 app 并测试
# 观察到这时这个process占用了5.6GB的内存
Requests per second:    519.39 [#/sec] (mean)
Time per request:       192.535 [ms] (mean)
Time per request:       1.925 [ms] (mean, across all concurrent requests)
Transfer rate:          78.62 [Kbytes/sec] received

# GOGC=500 下运行 app 并测试
# 观察到这时这个process占用了5.6GB的内存
Requests per second:    534.32 [#/sec] (mean)
Time per request:       187.153 [ms] (mean)
Time per request:       1.872 [ms] (mean, across all concurrent requests)
Transfer rate:          80.88 [Kbytes/sec] received

# GOGC=1000 下运行 app 并测试
# 观察到这时这个process占用了11GB的内存
Requests per second:    544.50 [#/sec] (mean)
Time per request:       183.656 [ms] (mean)
Time per request:       1.837 [ms] (mean, across all concurrent requests)
Transfer rate:          82.42 [Kbytes/sec] received

# GOGC=10000 下运行 app 并测试
# 观察到这时这个process占用了50GB的内存
Requests per second:    175.82 [#/sec] (mean)
Time per request:       568.756 [ms] (mean)
Time per request:       5.688 [ms] (mean, across all concurrent requests)
Transfer rate:          26.61 [Kbytes/sec] received

# GOGC=off 下运行 app 并测试
# 观察到这时这个process占用了50GB的内存
Requests per second:    175.38 [#/sec] (mean)
Time per request:       570.196 [ms] (mean)
Time per request:       5.702 [ms] (mean, across all concurrent requests)
Transfer rate:          26.55 [Kbytes/sec] received
这就很有意思了,调高GOGC后,throughput 轻微的上升,然后急速的下降。
这是可以解释的:
- “throughput 轻微的上升”是因为通过多用内存换了一点CPU时间片,从而提高了throughput
- “然后急速的下降”是因为使用了太多的内存,从而不得不大量进行swap导致throughput急速下降
总的来说,这种做法其实是治标不治本,并没有从根本上解决内存分配过于频繁的问题。
而且,如果GOGC 设置太大,反而因为进行swap导致性能急速下降。
Reference
- https://pkg.go.dev/runtime
- https://dave.cheney.net/tag/gogc
- https://archive.fosdem.org/2019/schedule/event/gogc/attachments/slides/3134/export/events/attachments/gogc/slides/3134/Go_GC_Settings_Bryan_Boreham.pdf