PProf
pprof is a tool for visualization and analysis of profiling data.
pprof reads a collection of profiling samples in profile.proto format and generates reports to visualize and help analyze the data. It can generate both text and graphical reports (through the use of the dot visualization package).
profile.proto is a protocol buffer that describes a set of callstacks and symbolization information. A common usage is to represent a set of sampled callstacks from statistical profiling. The format is described on the proto/profile.proto file. For details on protocol buffers, see https://developers.google.com/protocol-buffers
Profiles can be read from a local file, or over http. Multiple profiles of the same type can be aggregated or compared.
If the profile samples contain machine addresses, pprof can symbolize them through the use of the native binutils tools (addr2line and nm).
想要进行性能优化,首先瞩目在 Go 自身提供的工具链来作为分析依据,本文将带你学习、使用 Go 后花园,涉及如下:
- runtime/pprof:适用于对一次性运行程序(即你的应用是运行一段时间后就结束了)的运行数据进行分析
- net/http/pprof:适用于对长时间运行程序(即你的应用是一直不断在运行的),监控程序会启动一个 HTTP Server 以暴露一个提供运行时采样数据的HTTP接口
可以做什么
- CPU Profiling:CPU profile determines where a program spends its time while actively consuming CPU cycles (as opposed to while sleeping or waiting for I/O).
- Memory Profiling:Heap profile reports memory allocation samples; used to monitor current and historical memory usage, and to check for memory leaks.
- Block Profiling:Block profile shows where goroutines block waiting on synchronization primitives (including timer channels). Block profile is not enabled by default; use
runtime.SetBlockProfileRateto enable it. - Mutex Profiling:Mutex profile reports the lock contentions. When you think your CPU is not fully utilized due to a mutex contention, use this profile. Mutex profile is not enabled by default, see
runtime.SetMutexProfileFractionto enable it. - Gorontine:Goroutine profile reports the stack traces of all current goroutines.
Usage
via Interactive Terminal
Without a format specifier:
$ go tool pprof [options] source

# e.g.,
# do profiling via http endpoint exposed
$ go tool pprof http://localhost:6060/debug/pprof/profile\?seconds\=6
# do profiling via a local file
$ go tool pprof pprof.out
pprof will start an interactive shell in which the user can type commands. Type help to get online help.
via Web Interface
If a host:port is specified on the command line:
$ go tool pprof -http [host]:[port] [options] <source>
pprof will start serving HTTP requests on the specified port. Visit the HTTP url corresponding to the port (typically http://<host>:<port>/) in a browser to see the interface.
# e.g.,
$ go tool pprof -http : pprof.out
$ go tool pprof -http localhost:1111 pprof.out

$ go tool pprof -http : http://localhost:6060/debug/pprof/profile\?seconds\=6
$ go tool pprof -http localhost:1111 http://localhost:6060/debug/pprof/profile\?seconds\=6

# e.g.,
# do profiling via http endpoint exposed
$ go tool pprof -http : http://localhost:6060/debug/pprof/profile\?seconds\=6
# do profiling via a local file
$ go tool pprof -http : pprof.out
- Provide web interface at host:port.
- Host is optional and ’localhost’ by default.
- Port is optional and a randomly available port by default.
Interpreting the Callgraph
- Node Color:
- large positive cum values are red.
- large negative cum values are green.
- cum values close to zero are grey.
- Node Font Size:
- larger font size means larger absolute flat values.
- smaller font size means smaller absolute flat values.
- Edge Weight:
- thicker edges indicate more resources were used along that path.
- thinner edges indicate fewer resources were used along that path.
- Edge Color:
- large positive values are red.
- large negative values are green.
- values close to zero are grey.
- Dashed Edges: some locations between the two connected locations were removed.
- Solid Edges: one location directly calls the other.
- "(inline)" Edge Marker: the call has been inlined into the caller.
Let’s consider the following example graph:

-
For nodes:
(*Rand).Readhas a small flat value and a small cum value because the the font is small and the node is grey.(*compressor).deflatehas a large flat value and a large cum value because the font is large and the node is red.(*Writer).Flushhas a small flat value and a large cum value because the font is small and the node is red.
-
For edges:
-
the edge between
(*Writer).Writeand(*compressor).write:- Since it is a dashed edge, some nodes were removed between those two.
- Since it is thick and red, more resources were used in call stacks between those two nodes.
-
the edge between
(*Rand).Readandread:- Since it is a dashed edge, some nodes were removed between those two.
- Since it is thin and grey, fewer resources were used in call stacks between those two nodes.
-
the edge between
readand(*rngSource).Int63:- Since it is a solid edge, there are no nodes between those two (i.e. it was a direct call).
- Since it is thin and grey, fewer resrouces were used in call stacks between those two nodes.
-
Demo
demo.go,文件内容:
package main

import (
    "log"
    "net/http"
    _ "net/http/pprof"
    "GoPlayground/sw_pprof/data"
)

func main() {
    go func() {
        for {
            log.Println(data.Add("https://github.com/123456789"))
        }
    }()

    http.ListenAndServe("0.0.0.0:6060", nil)
}
data/d.go,文件内容:
package data

var datas []string

func Add(str string) string {
    data := []byte(str)
    sData := string(data)
    datas = append(datas, sData)

    return sData
}
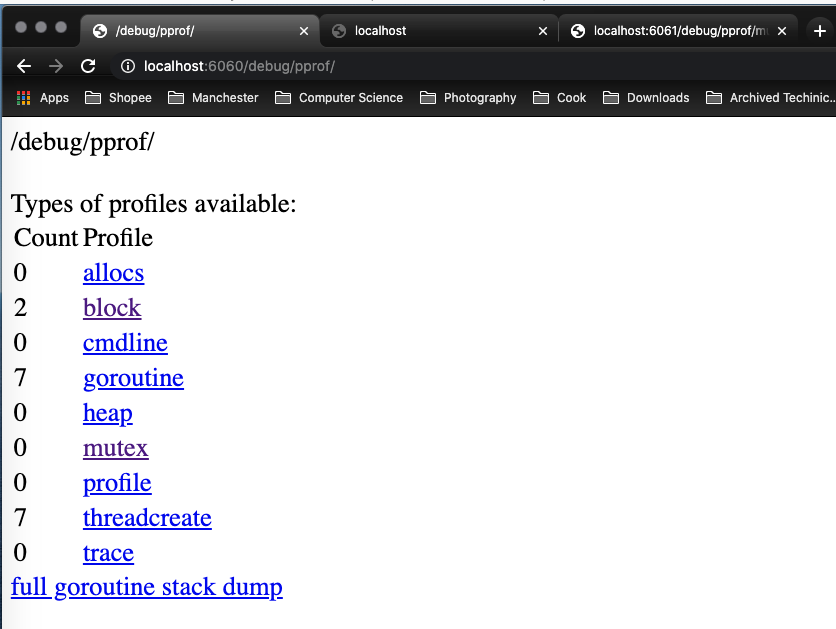
运行这个文件后,pprof监测程序会启动一个 HTTP service (运行在 http://127.0.0.1:6060/ 下),其中包含一个 /debug/pprof endpoint ,它可用于获取 pprof 观察到的应用程序情况。
Analysis Approaches
[Approach 1] 通过 Web 界面
运行住程序后,访问 http://127.0.0.1:6060/debug/pprof/ 。
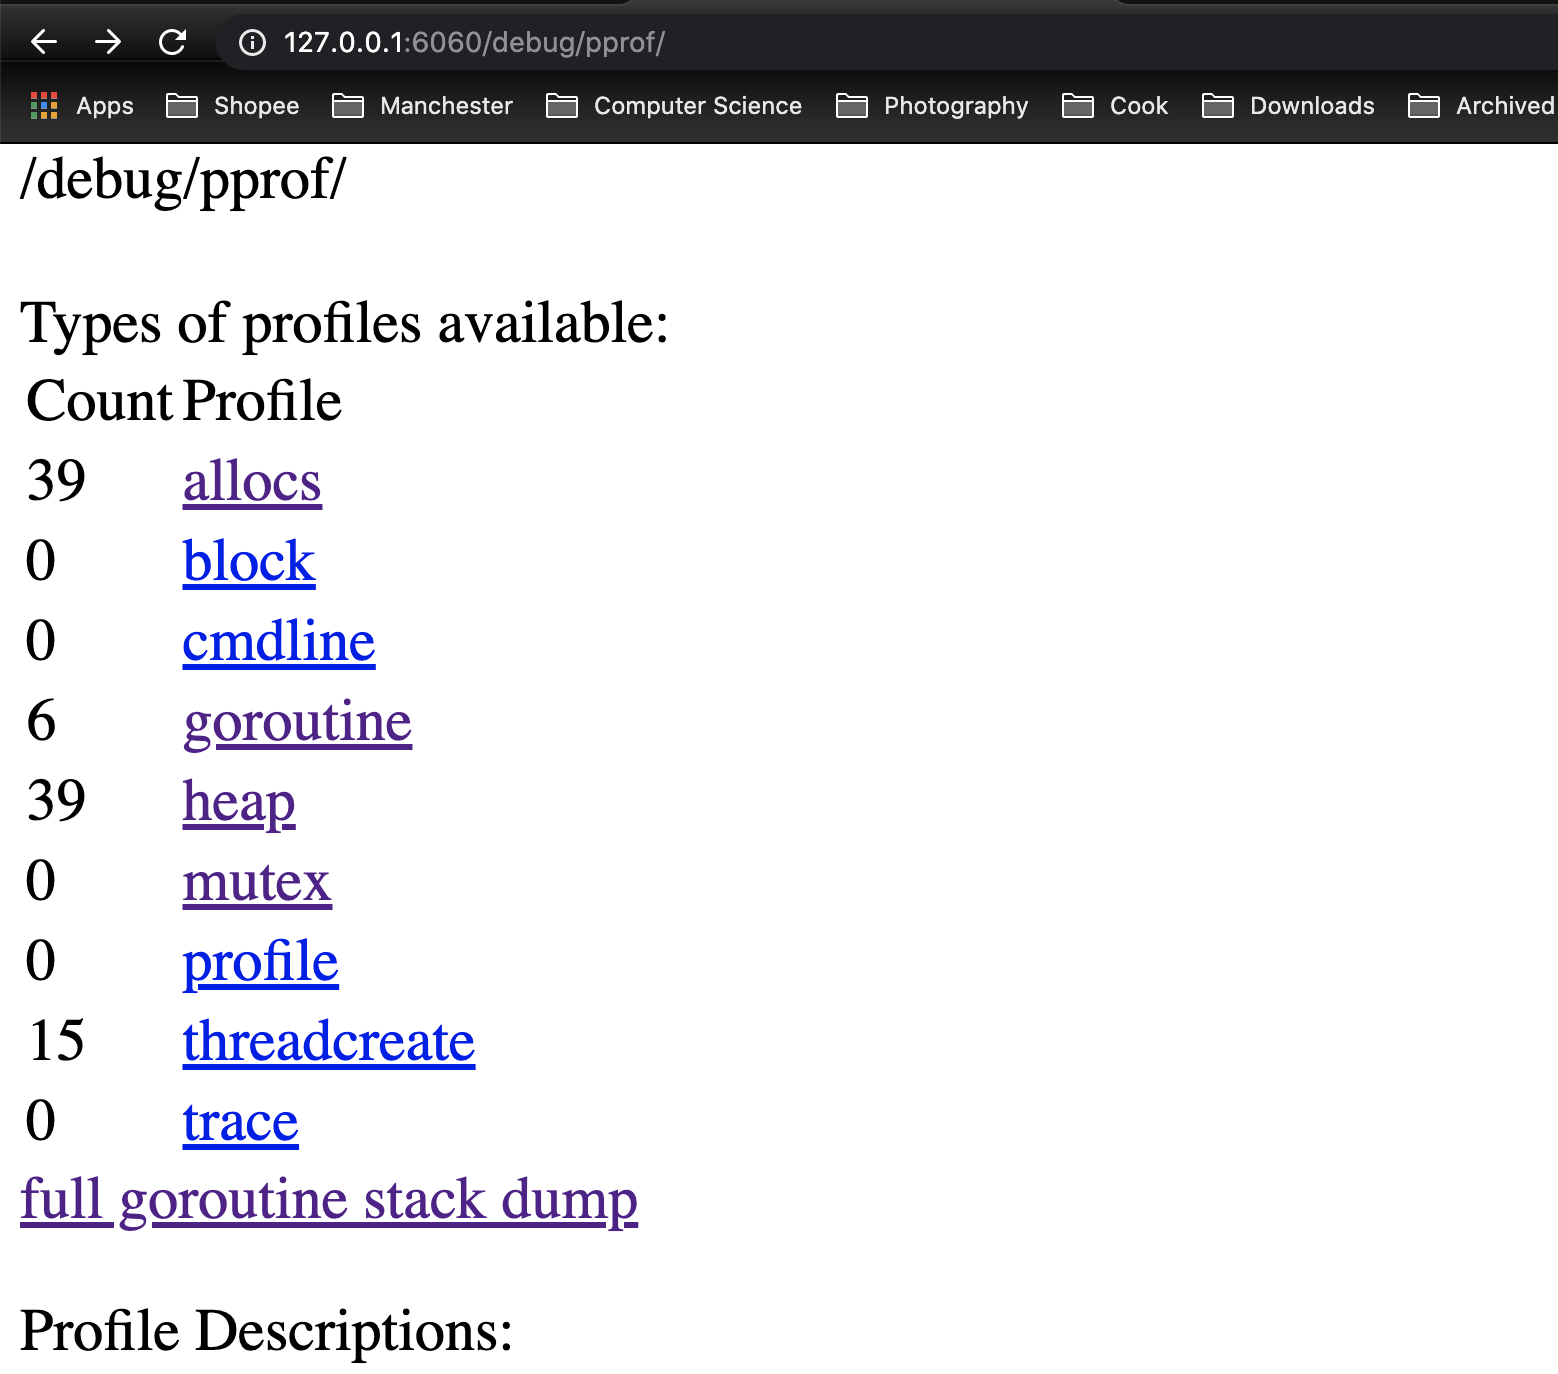
Profile Descriptions:
- allocs: A sampling of all past memory allocations
- block (Block Profiling): Stack traces that led to blocking on synchronization primitives
- cmdline: The command line invocation of the current program
- goroutine: Stack traces of all current goroutines
- heap: A sampling of memory allocations of live objects. You can specify the gc GET parameter to run GC before taking the heap sample.
- mutex: Stack traces of holders of contended mutexes
- profile (CPU Profiling): You can specify the duration in the seconds GET parameter. After you get the profile file, use the go tool pprof command to investigate the profile.
- threadcreate: Stack traces that led to the creation of new OS threads
- trace: A trace of execution of the current program. You can specify the duration in the seconds GET parameter. After you get the trace file, use the go tool trace command to investigate the trace.
[Approach 2] 通过 CLI
运行住程序后,执行
$ go tool pprof http://localhost:6060/debug/pprof/profile\?seconds\=60
...
常用命令
# 生成 .svg 图片
(pprof) web

# 查看 top N问题, top2
(pprof) top<N>

# 按关键字定位到具体问题代码
(pprof) list <keyword>
Reference
- https://github.com/google/pprof/blob/master/doc/README.md
- https://golang.org/doc/diagnostics.html
- https://golang.org/pkg/net/http/pprof/
- https://blog.golang.org/pprof
- https://golang.org/pkg/runtime/pprof/
- https://blog.wolfogre.com/posts/go-ppof-practice/