Tracing
trace工具可以看到GC被执行的次数和每次执行的时长
Tracing is a way to instrument code to analyze latency throughout the lifecycle of a chain of calls. Go provides golang.org/x/net/trace package as a minimal tracing backend per Go node and provides a minimal instrumentation library with a simple dashboard. Go also provides an execution tracer to trace the runtime events within an interval.
Tracing enables us to:
- Instrument and analyze application latency in a Go process.
- Measure the cost of specific calls in a long chain of calls.
- Figure out the utilization and performance improvements. Bottlenecks are not always obvious without tracing data.
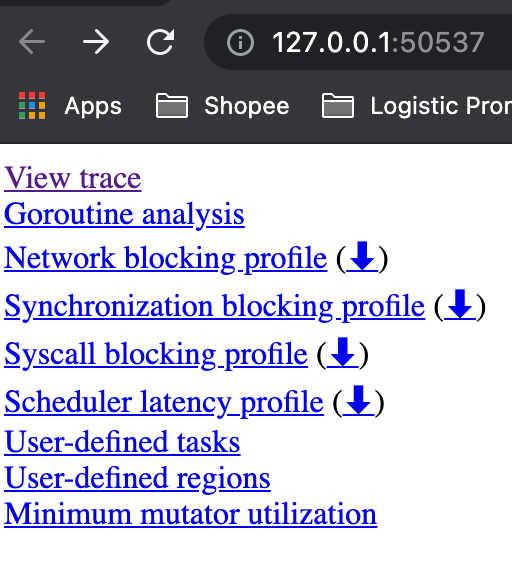
- View trace:查看跟踪
- Goroutine analysis:Goroutine 分析
- Network blocking profile:网络阻塞概况
- Synchronization blocking profile:同步阻塞概况
- Syscall blocking profile:系统调用阻塞概况
- Scheduler latency profile:调度延迟概况
- User defined tasks:用户自定义任务
- User defined regions:用户自定义区域
- Minimum mutator utilization:最低 Mutator 利用率
How to Start
package main

import (
	"os"
	"runtime/trace"
)

func main() {
	trace.Start(os.Stderr)
	defer trace.Stop()

	// Your program here
}
Approach 1
生成跟踪文件:
$ go run main.go 2> trace.out
启动可视化界面:
$ go tool trace trace.out
2021/07/18 11:19:19 Parsing trace...
2021/07/18 11:19:19 Splitting trace...
2021/07/18 11:19:19 Opening browser. Trace viewer is listening on http://127.0.0.1:50537
Approach 2
$ wget http://localhost:6060/debug/pprof/trace\?seconds\=5 -O /tmp/trace.out && go tool trace /tmp/trace.out
查看可视化界面:
View trace - 查看跟踪
- Timeline: 显示执行的时间,根据跟踪定位的不同,时间单位可能会发生变化。你可以通过使用键盘快捷键(WASD键,就像视频游戏一样😊)来导航时间轴。
- Heap: 在执行期间显示内存分配,这对于发现内存泄漏非常有用,并检查垃圾回收在每次运行时能够释放多少内存。
- Goroutines: 在每个时间点显示有多少goroutines在运行,有多少是可运行的(等待被调度的)。大量可运行的goroutines可能显示调度竞争,例如,当程序创建过多的goroutines,会导致调度程序繁忙。
- OS Threads: 显示有多少OS线程正在被使用,有多少个被syscalls阻塞。
- Virtual Processors: 每个虚拟处理器显示一行。虚拟处理器的数量由GOMAXPROCS环境变量控制(默认为内核数)。
- Goroutines and events:
- 显示在每个虚拟处理器上有什么goroutine在运行。连接goroutines的连线代表事件。在示例图片中,我们可以看到goroutine “G1.runtime.main”衍生出了两个不同的goroutines:G6和G5(前者是负责收集trace数据的goroutine,后者是我们使用“go”关键字启动的那个)。
- 每个处理器的第二行可能显示额外的事件,比如syscalls和运行时事件。这还包括goroutine代表运行时所做的一些工作(例如辅助垃圾回收)。
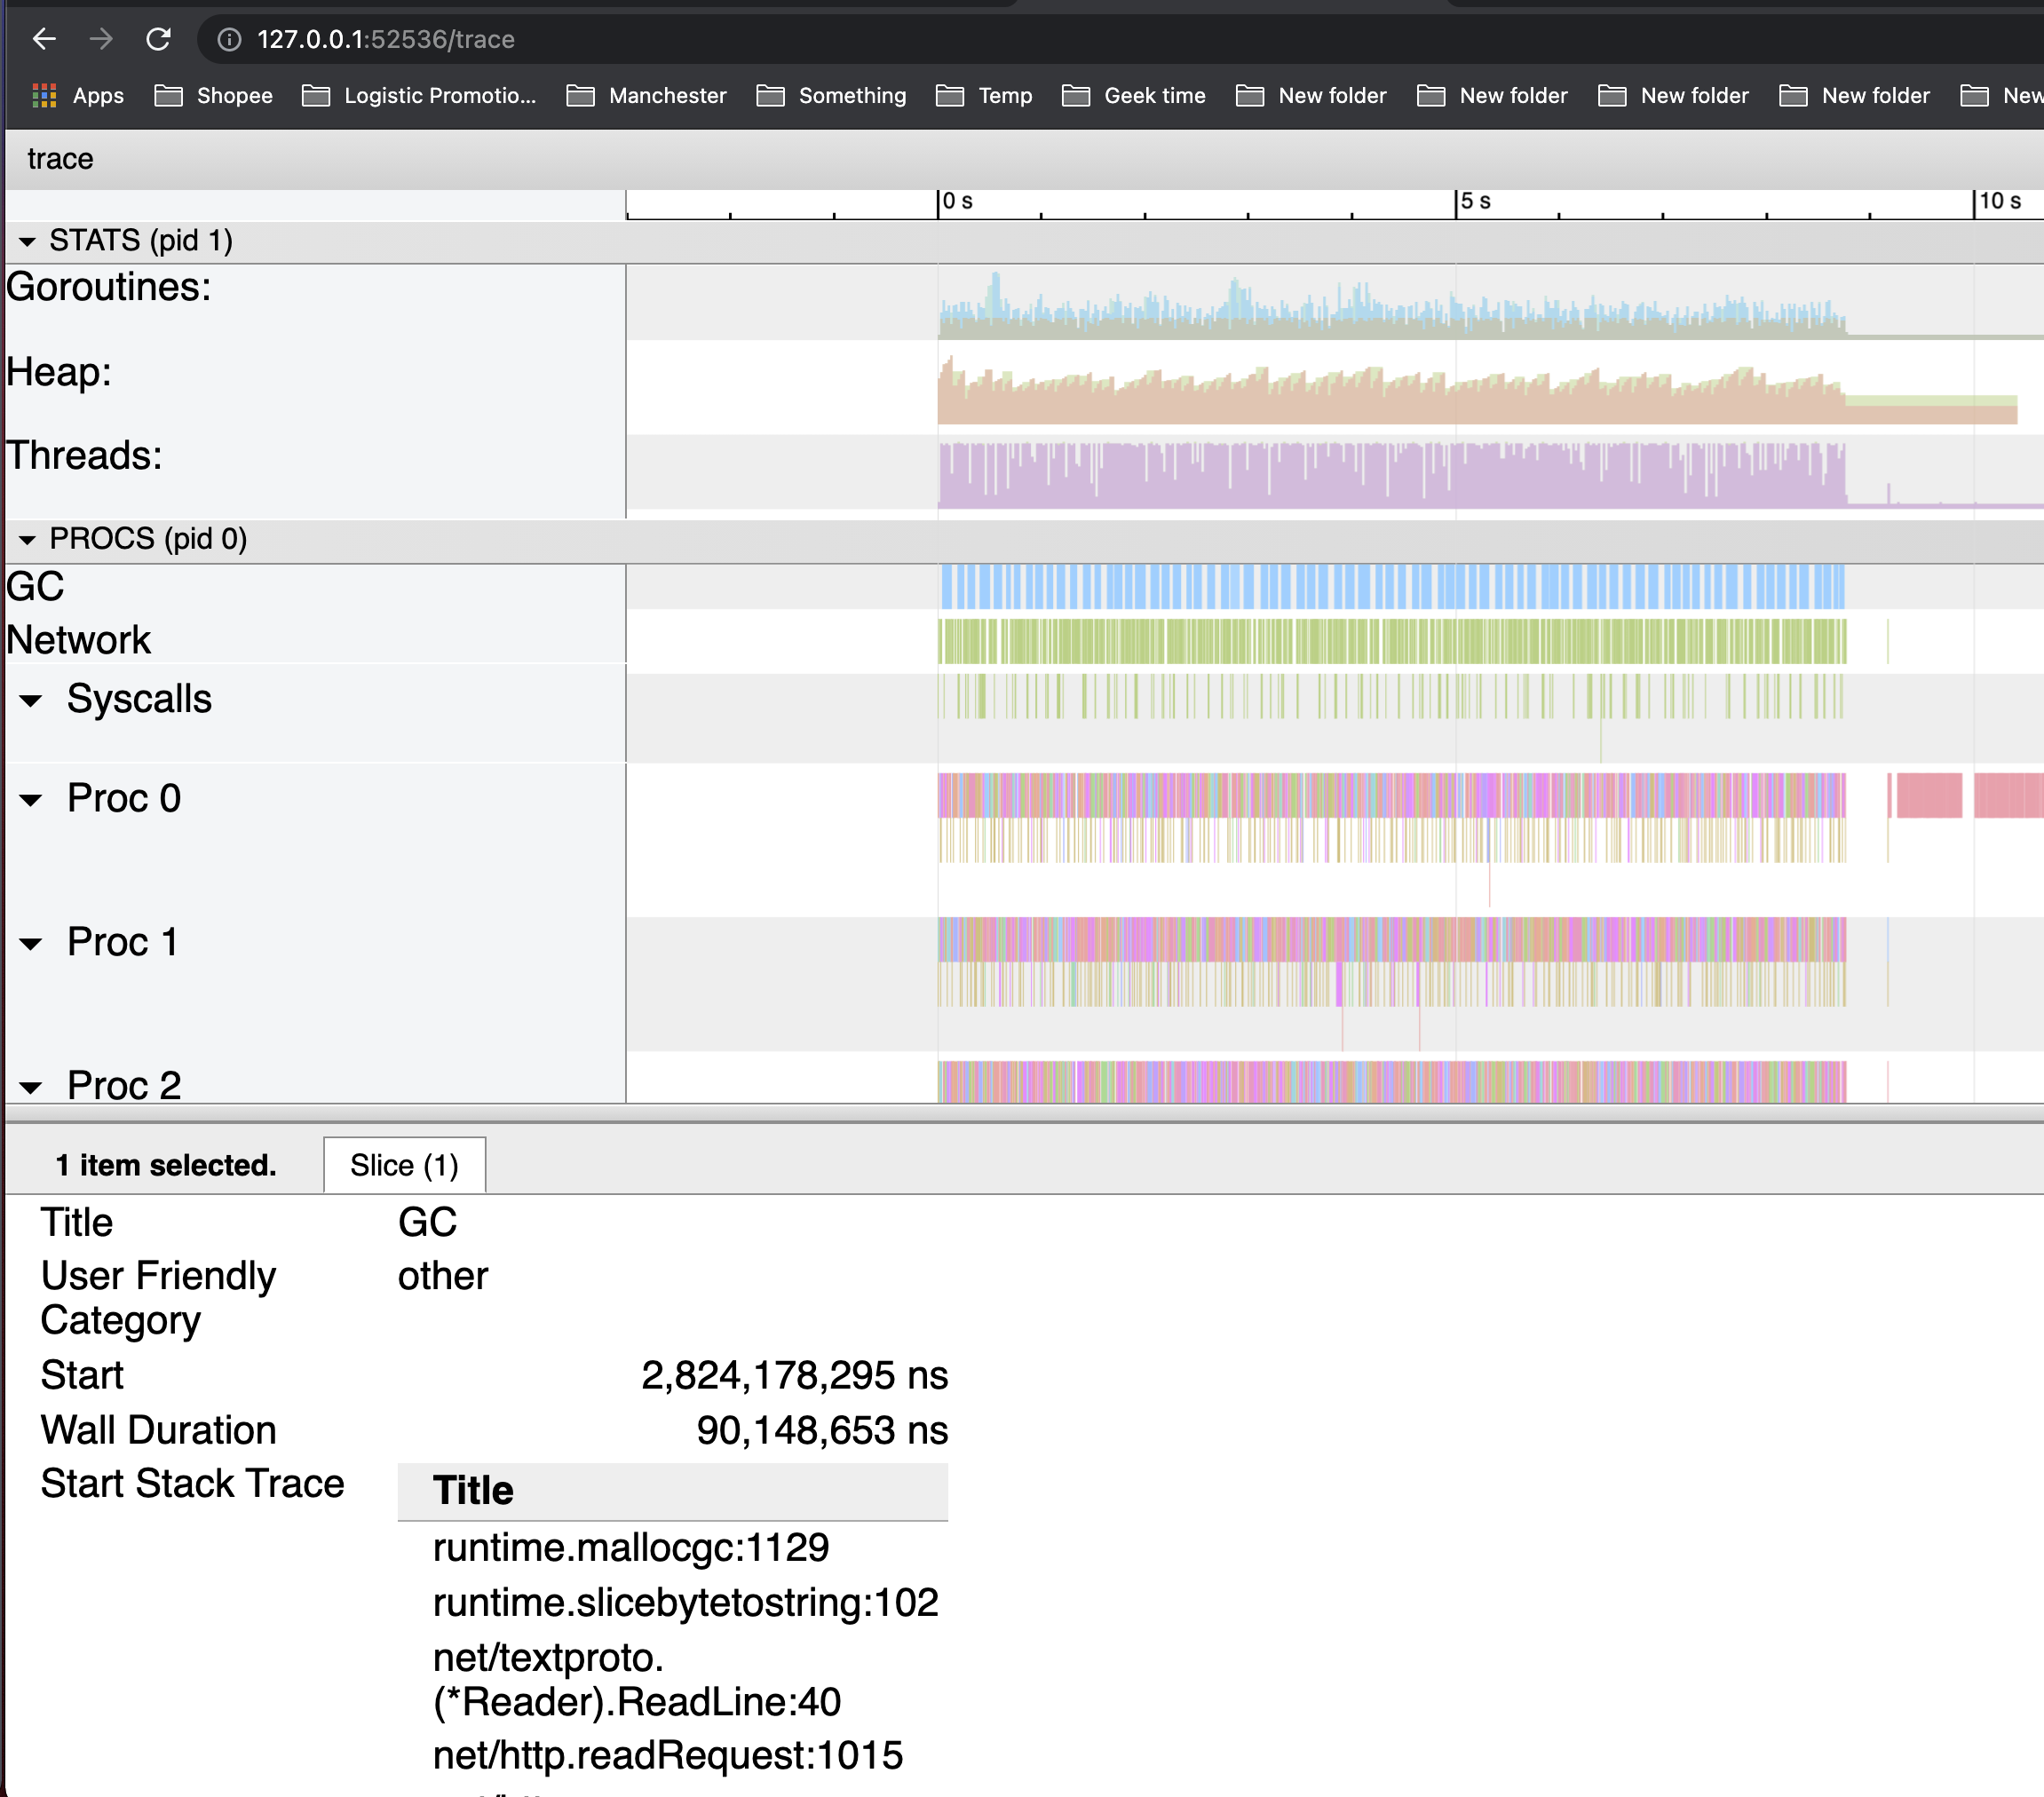
下图显示了当选择一个goroutine时得到的信息。该信息包含:
-
它的“名称”(Title)
-
何时开始(Start)
-
持续时间(Wall Duration)
-
开始时的栈trace
-
结束时的栈trace
-
该goroutine产生的事件
-
STW 是
gc中的两个"停止世界"的阶段。 在这两个阶段中,goroutine会停止运行。 -
GC(idle) 指没有标记内存时的goroutine。
-
MARK ASSIST 在分配内存过程中重新标记内存(mark the memory)的goroutine
-
SWEEP 垃圾清理
-
GXX runtime.gcBgMarkWorker 是帮助标记内存的专用后台goroutine。
Others
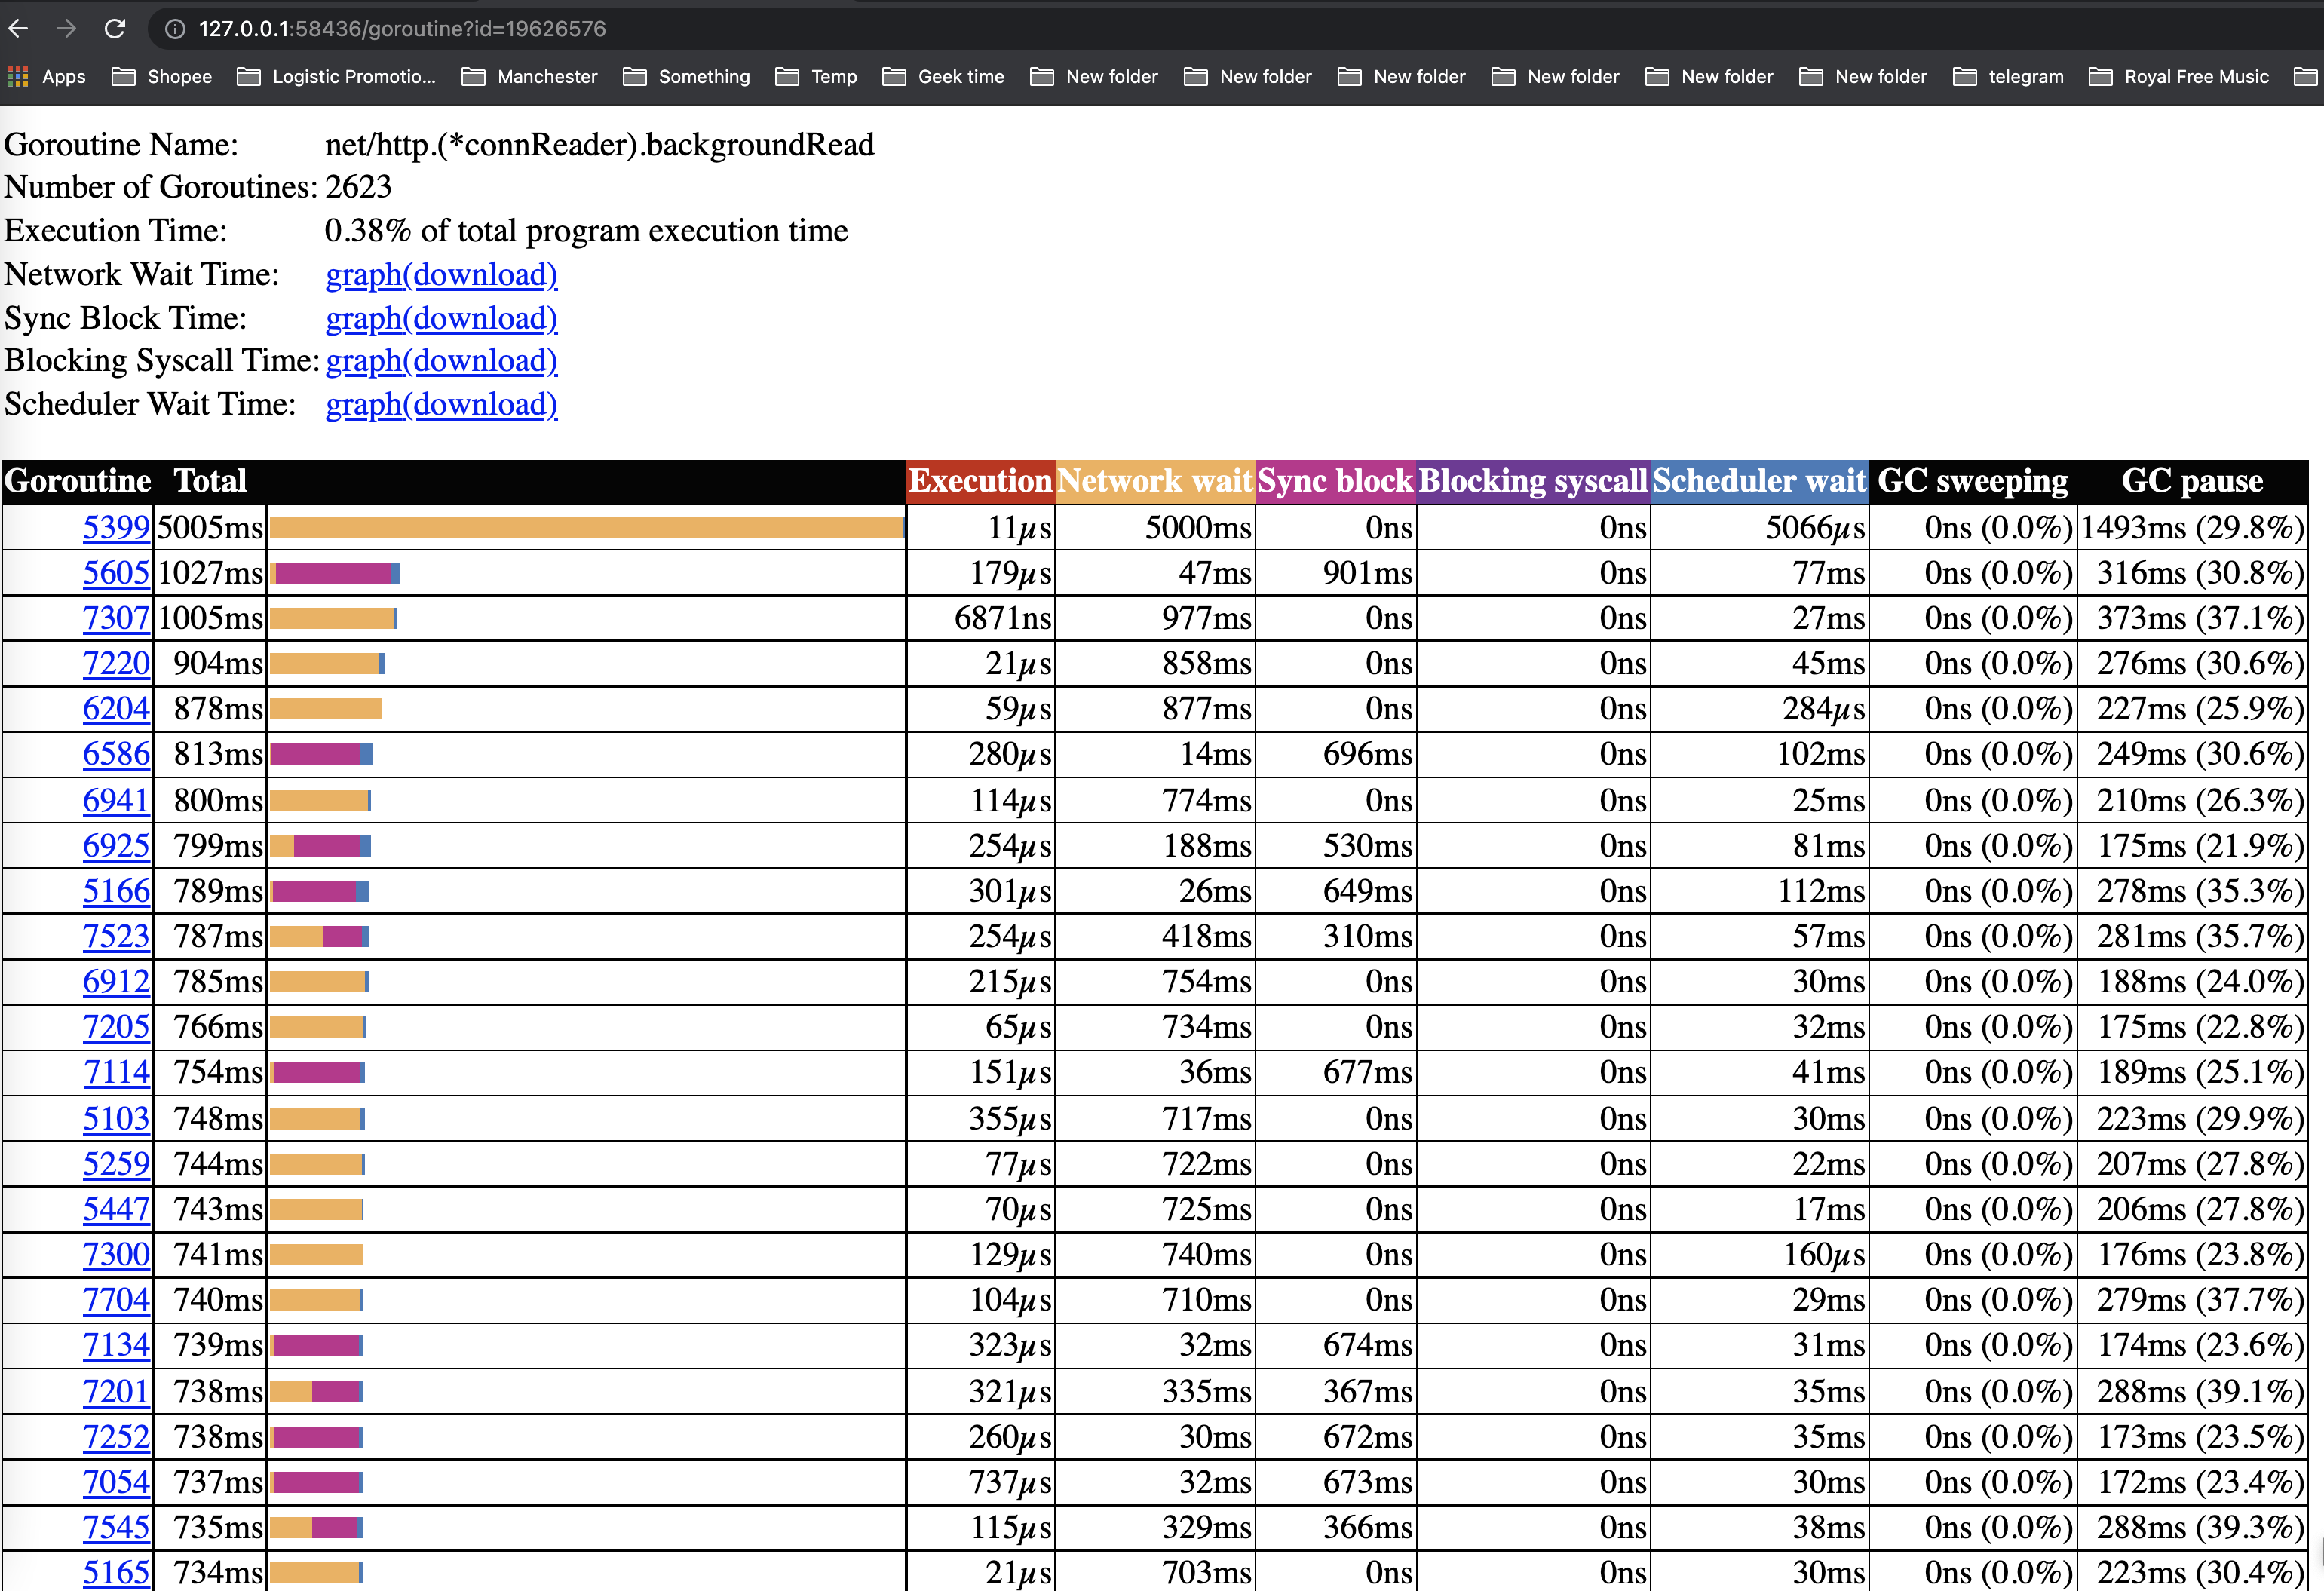
Goroutine analysis - Goroutine 分析
显示了在整个执行过程中,在不同代码处goroutines是如何创建的。在选择一种类型之后就可以看到关于这种类型的goroutine的信息。例如,在试图从mutex获取锁、从网络读取、运行等等每个goroutine被阻塞的时间。
Goroutines:
net/http.(*conn).serve N=101
runtime.gcBgMarkWorker N=69
net/http.(*connReader).backgroundRead N=2623
runtime.bgsweep N=1
runtime.bgscavenge N=1
runtime/trace.Start.func1 N=1
N=4
Network blocking profile - 网络阻塞概况
这些图表显示了goroutines在这些资源上所花费的时间。它们非常接近pprof上的内存/cpu分析。这是分析锁竞争的最佳选择。
Synchronization blocking profile - 同步阻塞概况
Syscall blocking profile - 系统调用阻塞概况
这些图表显示了goroutines在这些资源上所花费的时间。它们非常接近pprof上的内存/cpu分析。这是分析锁竞争的最佳选择。
Scheduler latency profile - 调度延迟概况
为调度器级别的信息提供计时功能,显示调度在哪里最耗费时间。
User defined tasks - 用户自定义任务
User defined regions - 用户自定义区域
Minimum mutator utilization - 最低 Mutator 利用率
Practice
Practice 1
我们来实际分析一个性能有待提高的app,以更好的展示如果使用 trace:
package main

import (
	"fmt"
	"os"
	"runtime"
	"runtime/trace"
	"sync/atomic"
	"time"
)

var (
	stop  int32
	count int64
	sum   time.Duration
)

func concat() {
	for n := 0; n < 100; n++ {
		for i := 0; i < 8; i++ {
			go func() {
				s := "Go GC"
				s += " " + "Hello"
				s += " " + "World"
				_ = s
			}()
		}
	}
}
func main() {
	f, _ := os.Create("trace.out")
	defer f.Close()
	trace.Start(f)
	defer trace.Stop()
	go func() {
		var t time.Time
		for atomic.LoadInt32(&stop) == 0 {
			t = time.Now()
			runtime.GC()
			sum += time.Since(t)
			count++
		}
		fmt.Printf("GC spend avg: %v\n", time.Duration(int64(sum)/count))
	}()
	concat()
	atomic.StoreInt32(&stop, 1)
}
$ go tool trace trace.out
2021/07/18 11:19:19 Parsing trace...
2021/07/18 11:19:19 Splitting trace...
2021/07/18 11:19:19 Opening browser. Trace viewer is listening on http://127.0.0.1:50537
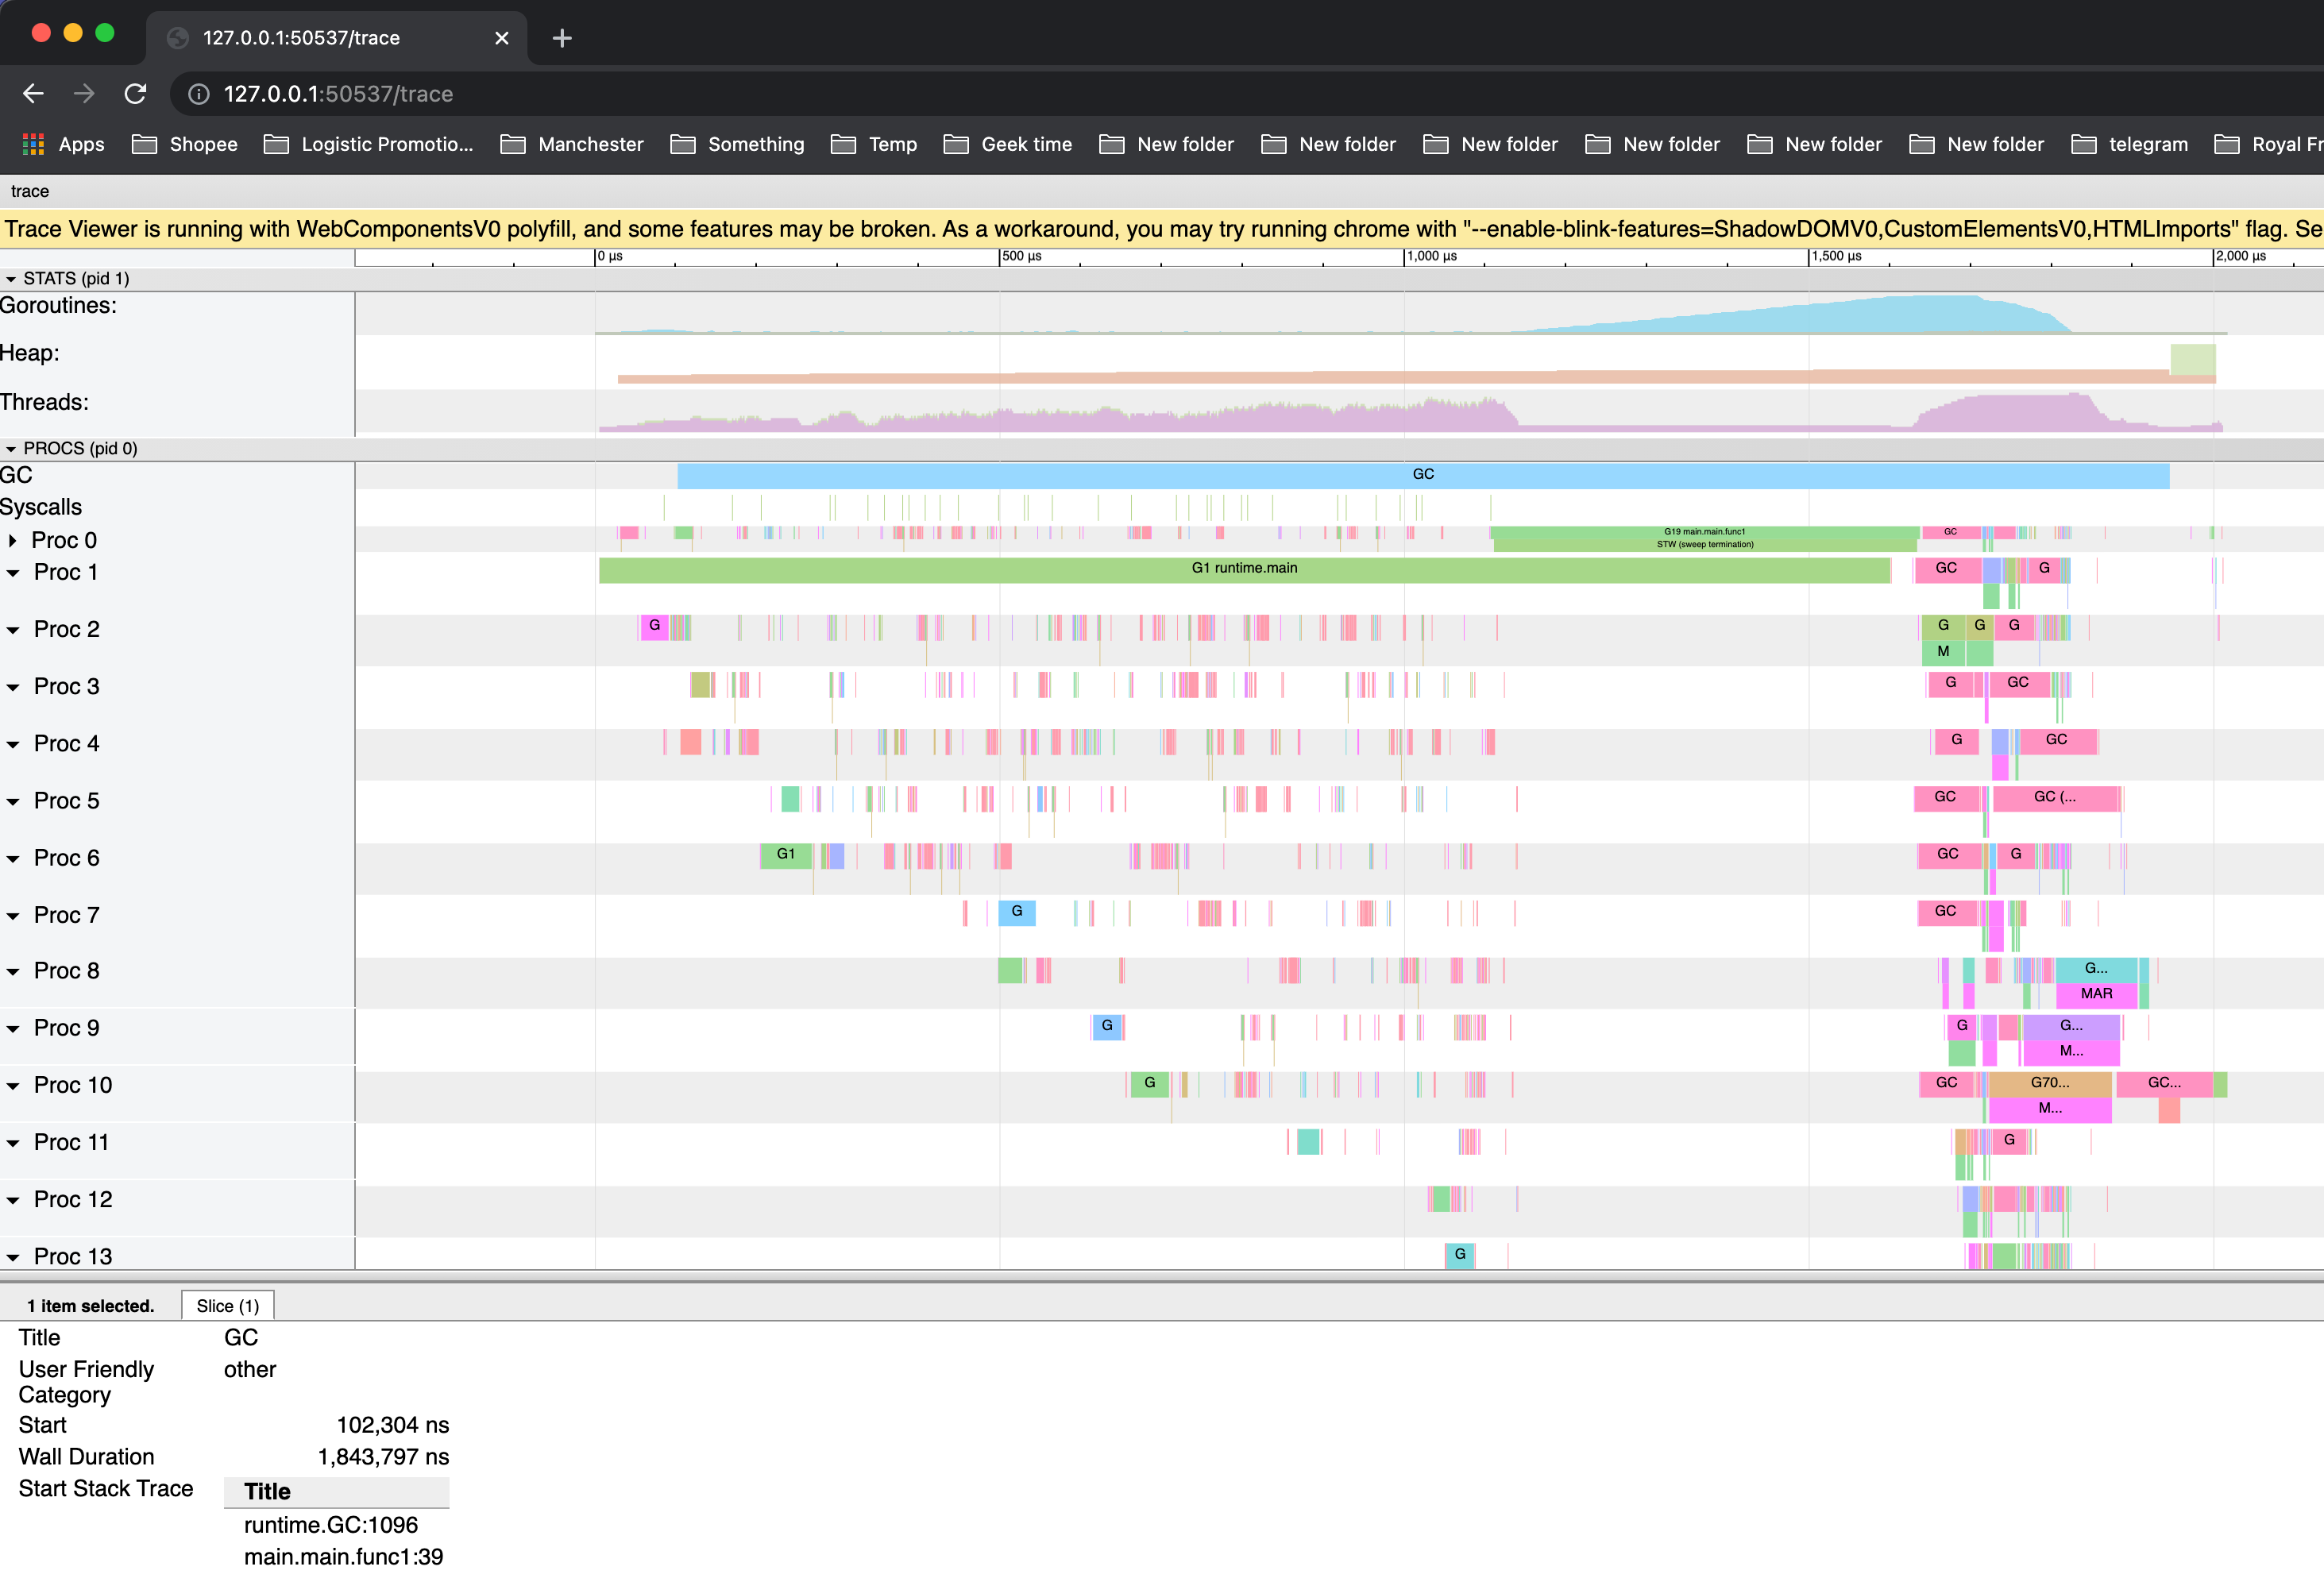
程序的整个执行过程中仅执行了一次 GC,且花费了1.7ms。
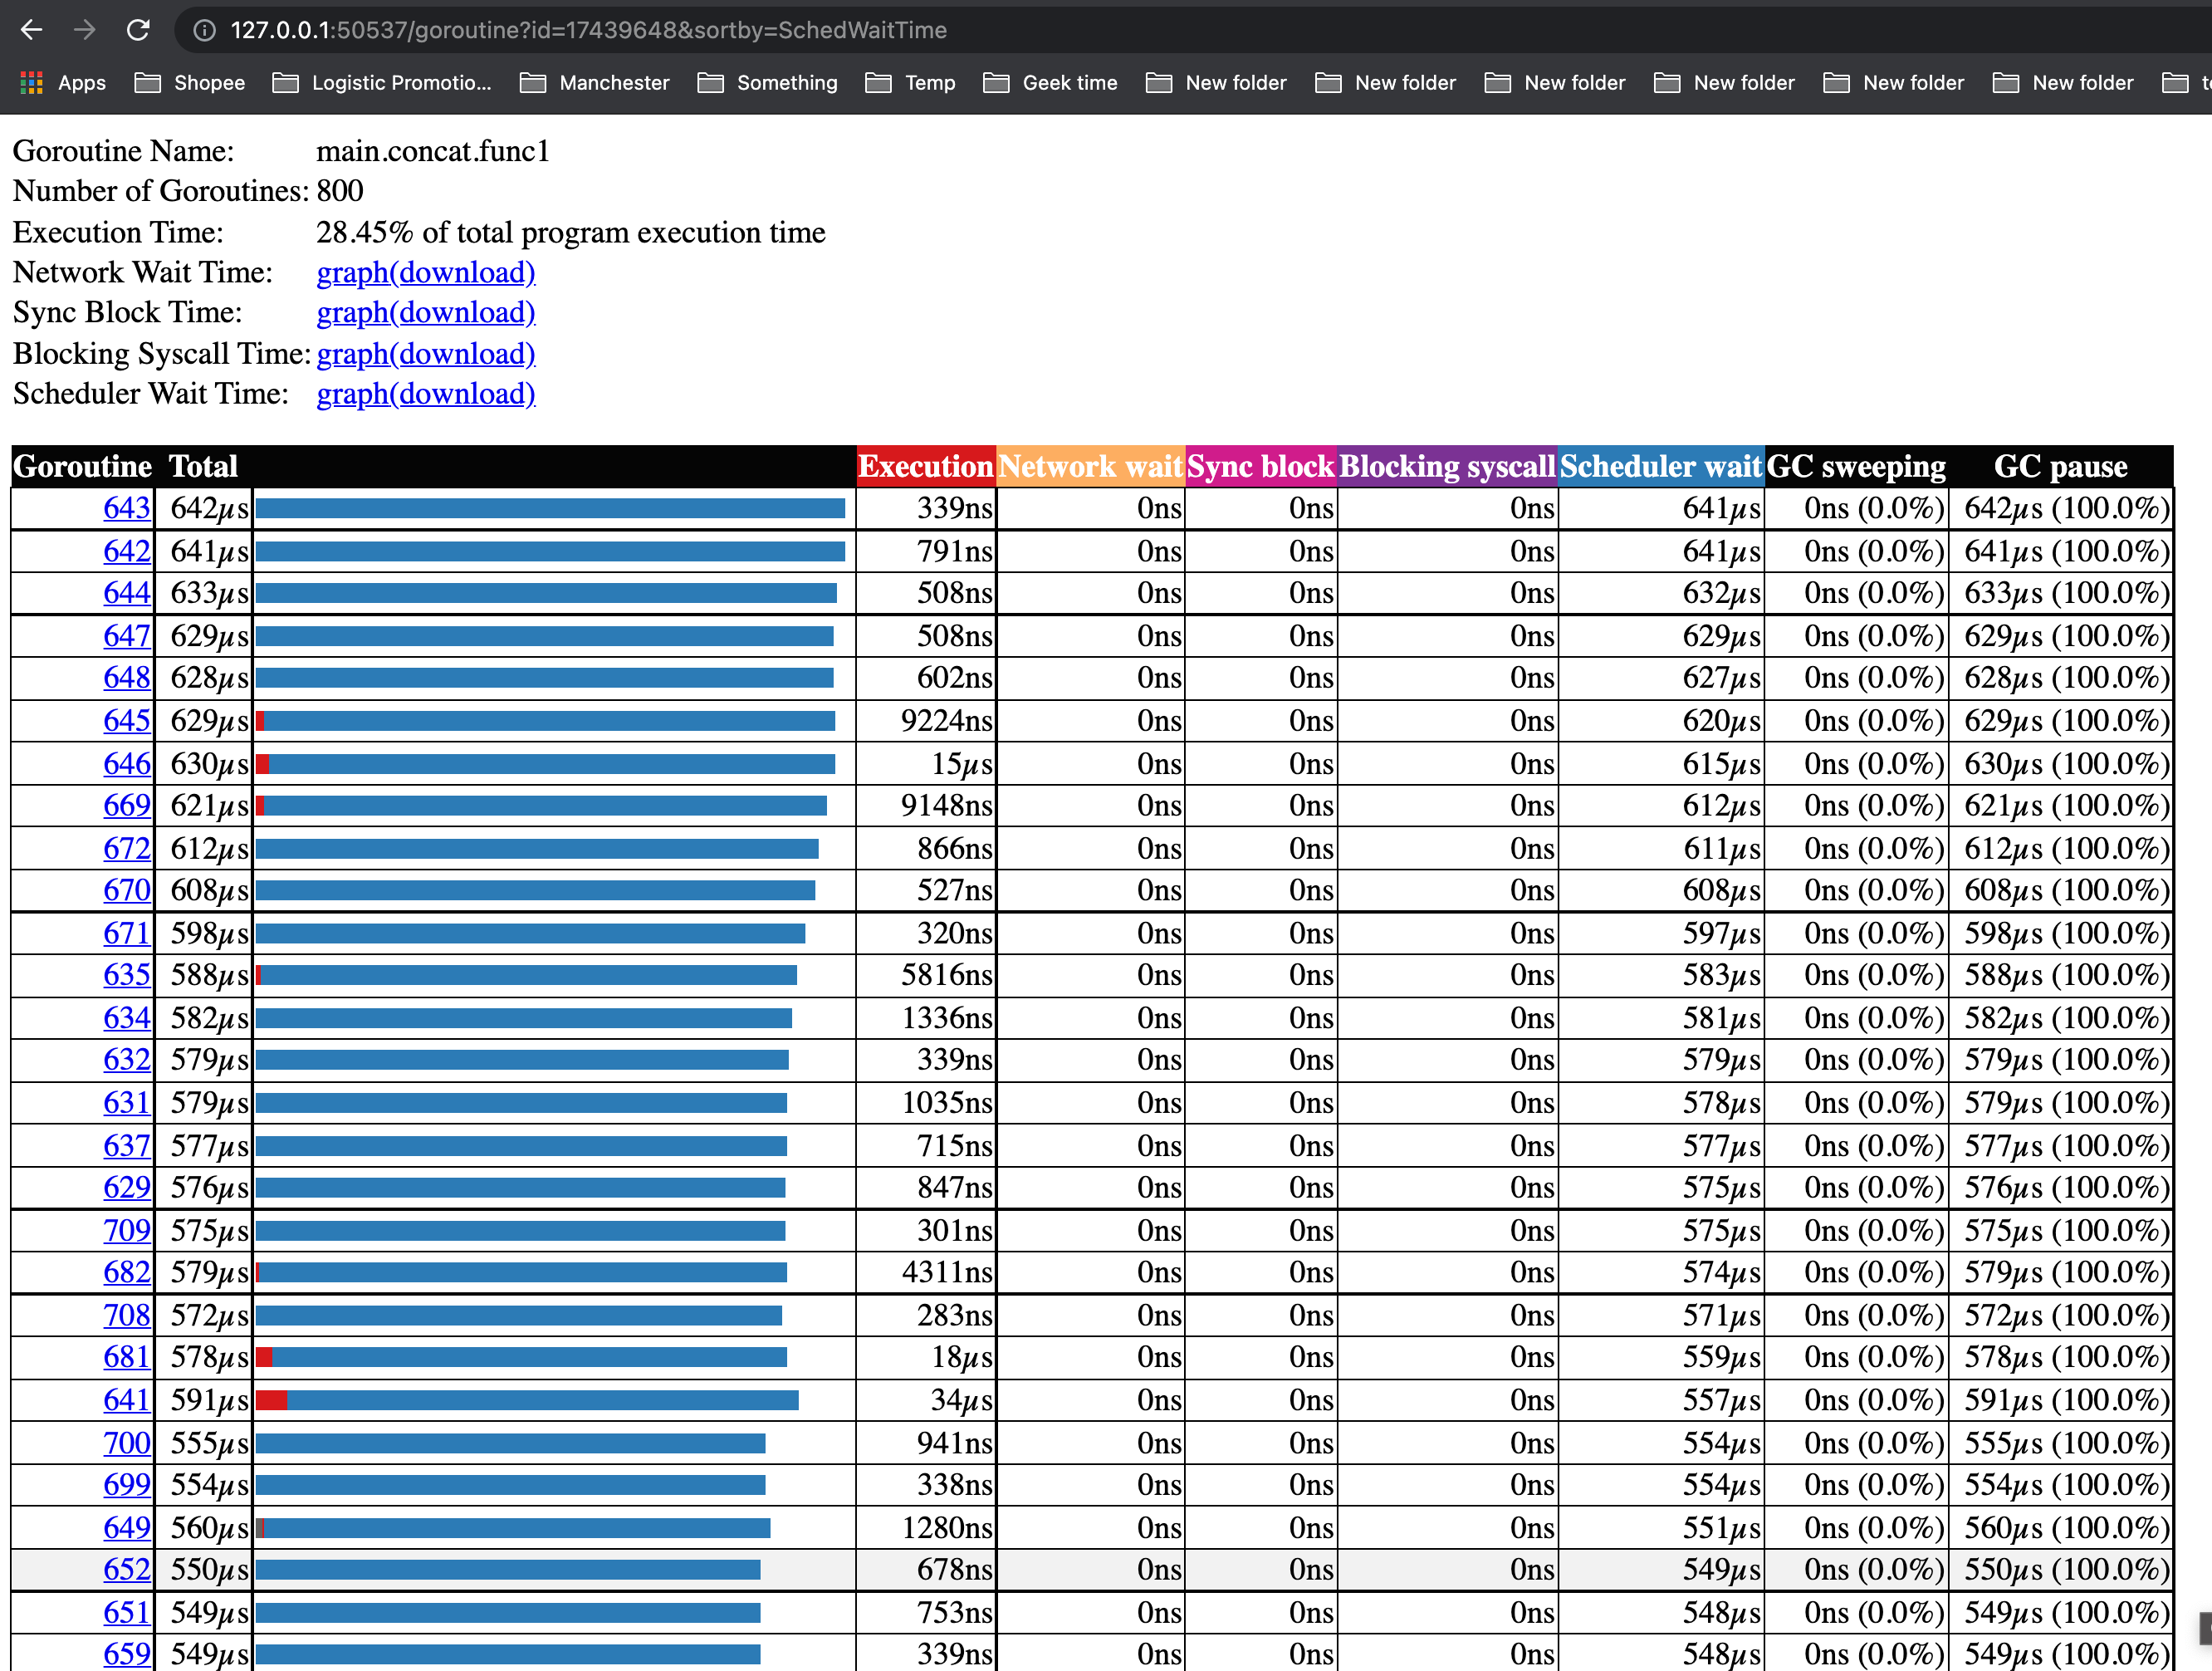
我们再看看goroutine的情况,我们共创建了这么多goroutine:
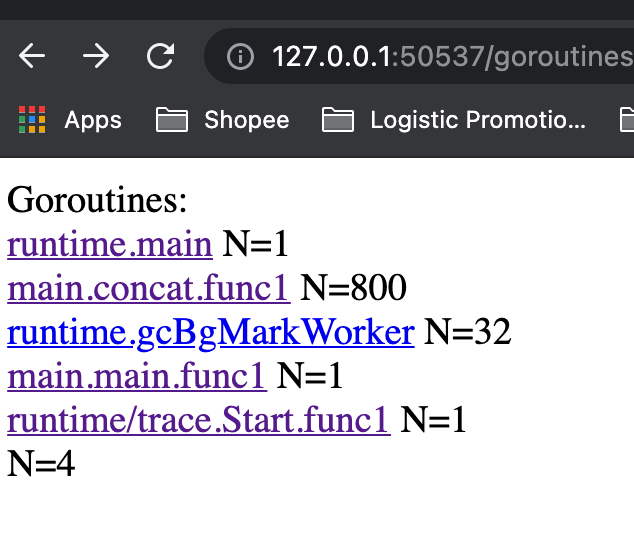
在 main.concat.func1 创建的大部分goroutine中,真正在goroutine中用于执行代码的时间占它生命周期的总时间非常小(红色部分),这意味着大部分时间都花在了等待被scheduler schedule上(蓝色部分)。
Practice 2 - 大量内存空间创建
在这个程序中,每当产生一个 /example2的请求时,都会创建一段内存,并用于进行一些后续的工作。
package main

import (
	"fmt"
	"net/http"
	_ "net/http/pprof"
)

func newBuf() []byte {
	return make([]byte, 10<<20)
}
func main() {
	go func() {
		http.ListenAndServe("localhost:6060", nil)
	}()
	http.HandleFunc("/example2", func(w http.ResponseWriter, r *http.Request) {
		b := newBuf()
		// 模拟执行一些工作
		for idx := range b {
			b[idx] = 1
		}
		fmt.Fprintf(w, "done, %v", r.URL.Path[1:])
	})
	http.ListenAndServe(":8080", nil)
}
为了进行性能分析,我们还额外创建了一个监听 6060 端口的 goroutine,用于使用 pprof 进行分析。我们先让服务器跑起来:
$ go run main.go
...
这时候我们使用一个压测工具 ab,来同时产生 5000 个请求(-n 一共 5000 个请求,-c 表示每次执行请求的数量,每次 100 个并发请求):
$ ab -k -n 5000 -c 100 http://127.0.0.1:8080/example2
...
Requests per second: 504.61 [#/sec] (mean)
Time per request: 198.173 [ms] (mean)
Time per request: 1.982 [ms] (mean, across all concurrent requests)
Transfer rate: 76.38 [Kbytes/sec] received
Connection Times (ms)
min mean[+/-sd] median max
Connect: 0 0 2.1 0 21
Processing: 9 197 160.1 125 1134
Waiting: 6 196 160.1 124 1134
Total: 9 197 160.1 125 1134
...
# At the same time
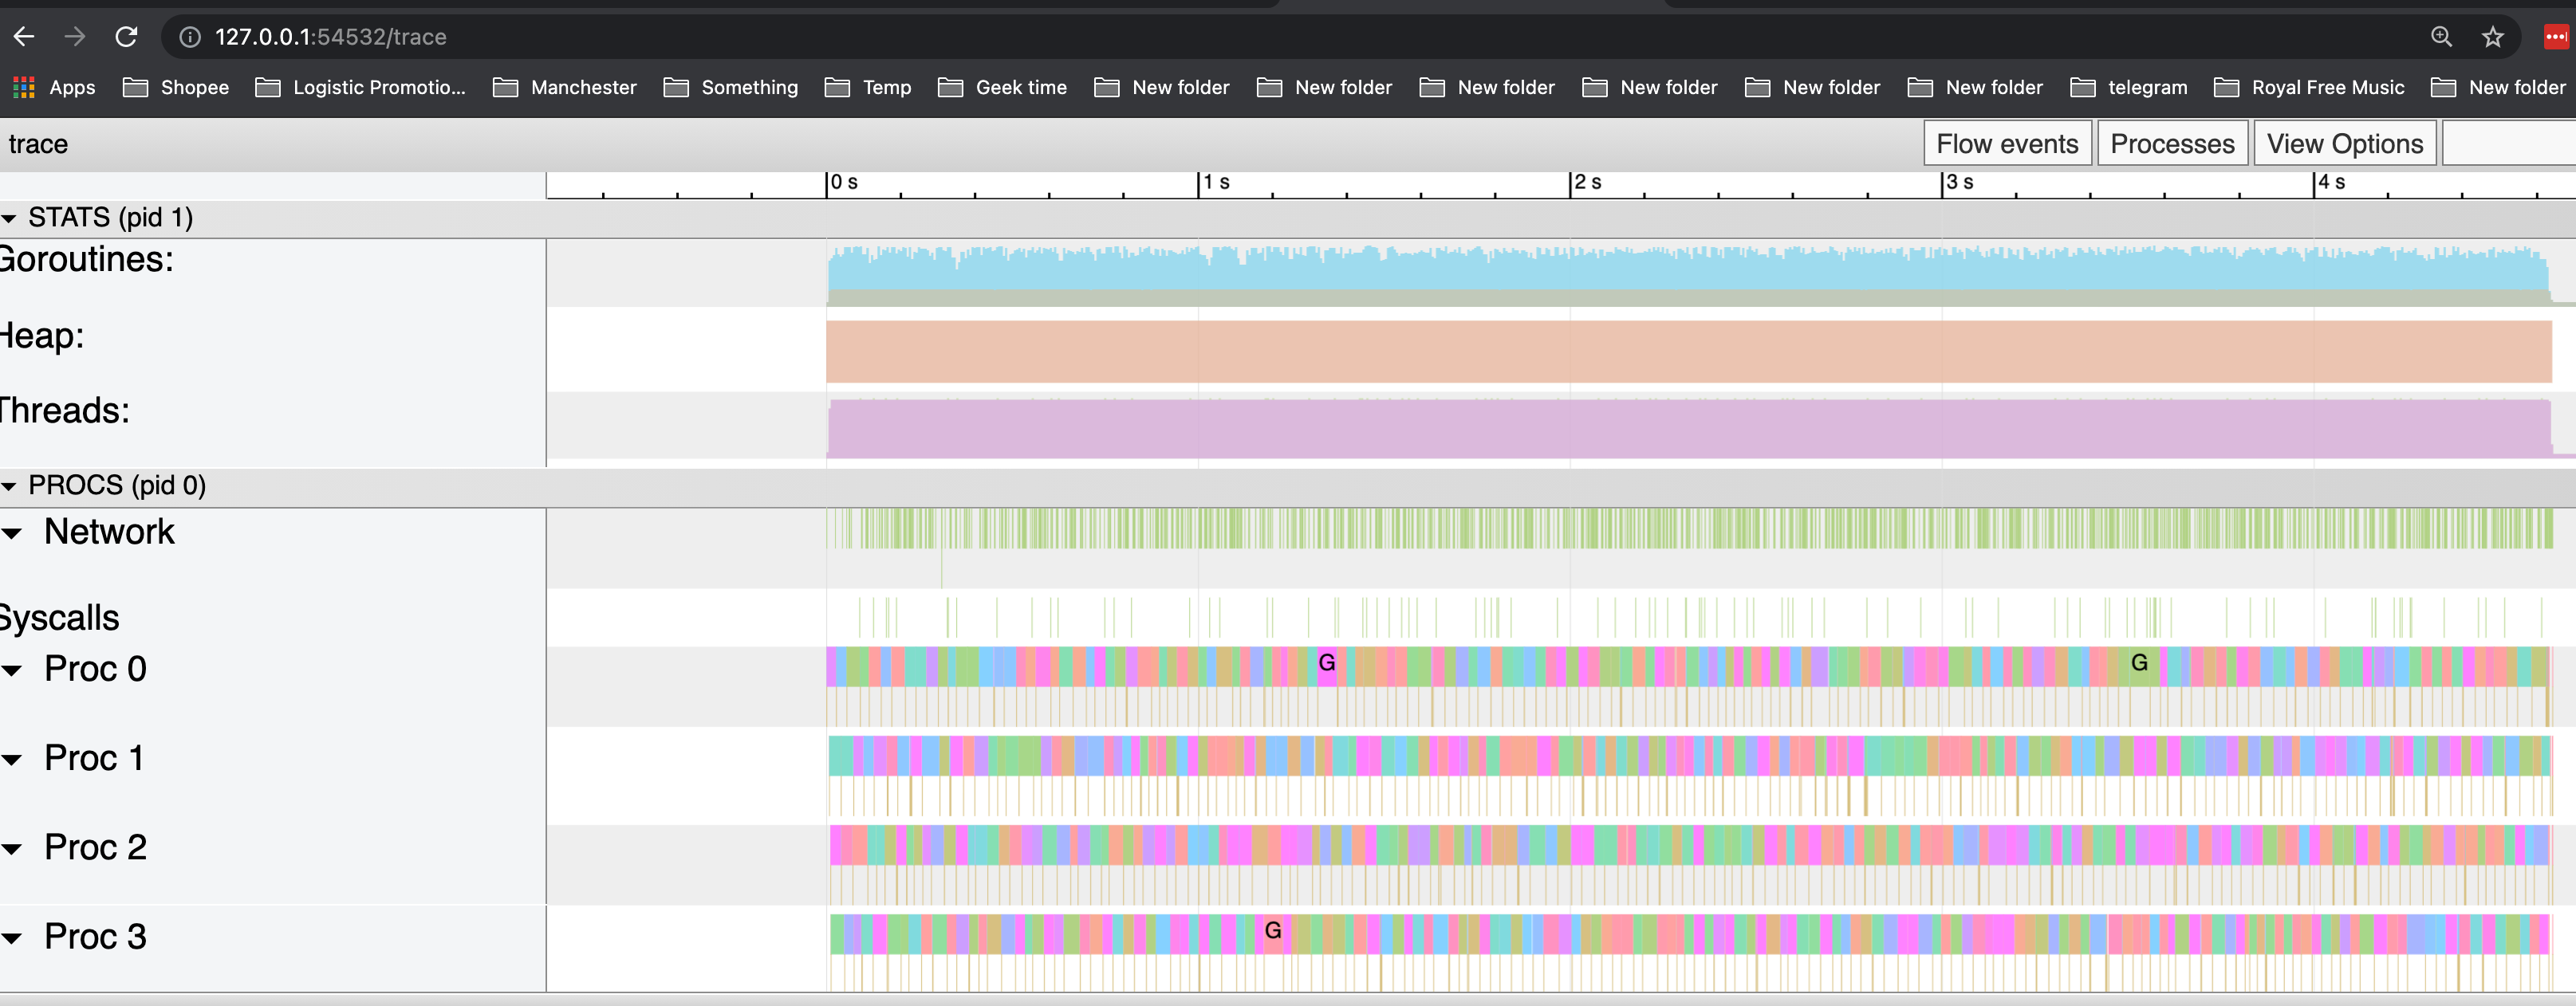
$ wget http://127.0.0.1:6060/debug/pprof/trace\?seconds\=5 -O /tmp/trace.out && go tool trace /tmp/trace.out
可以看到,GC 反复被触发,一个显而易见的原因就是内存分配过多。
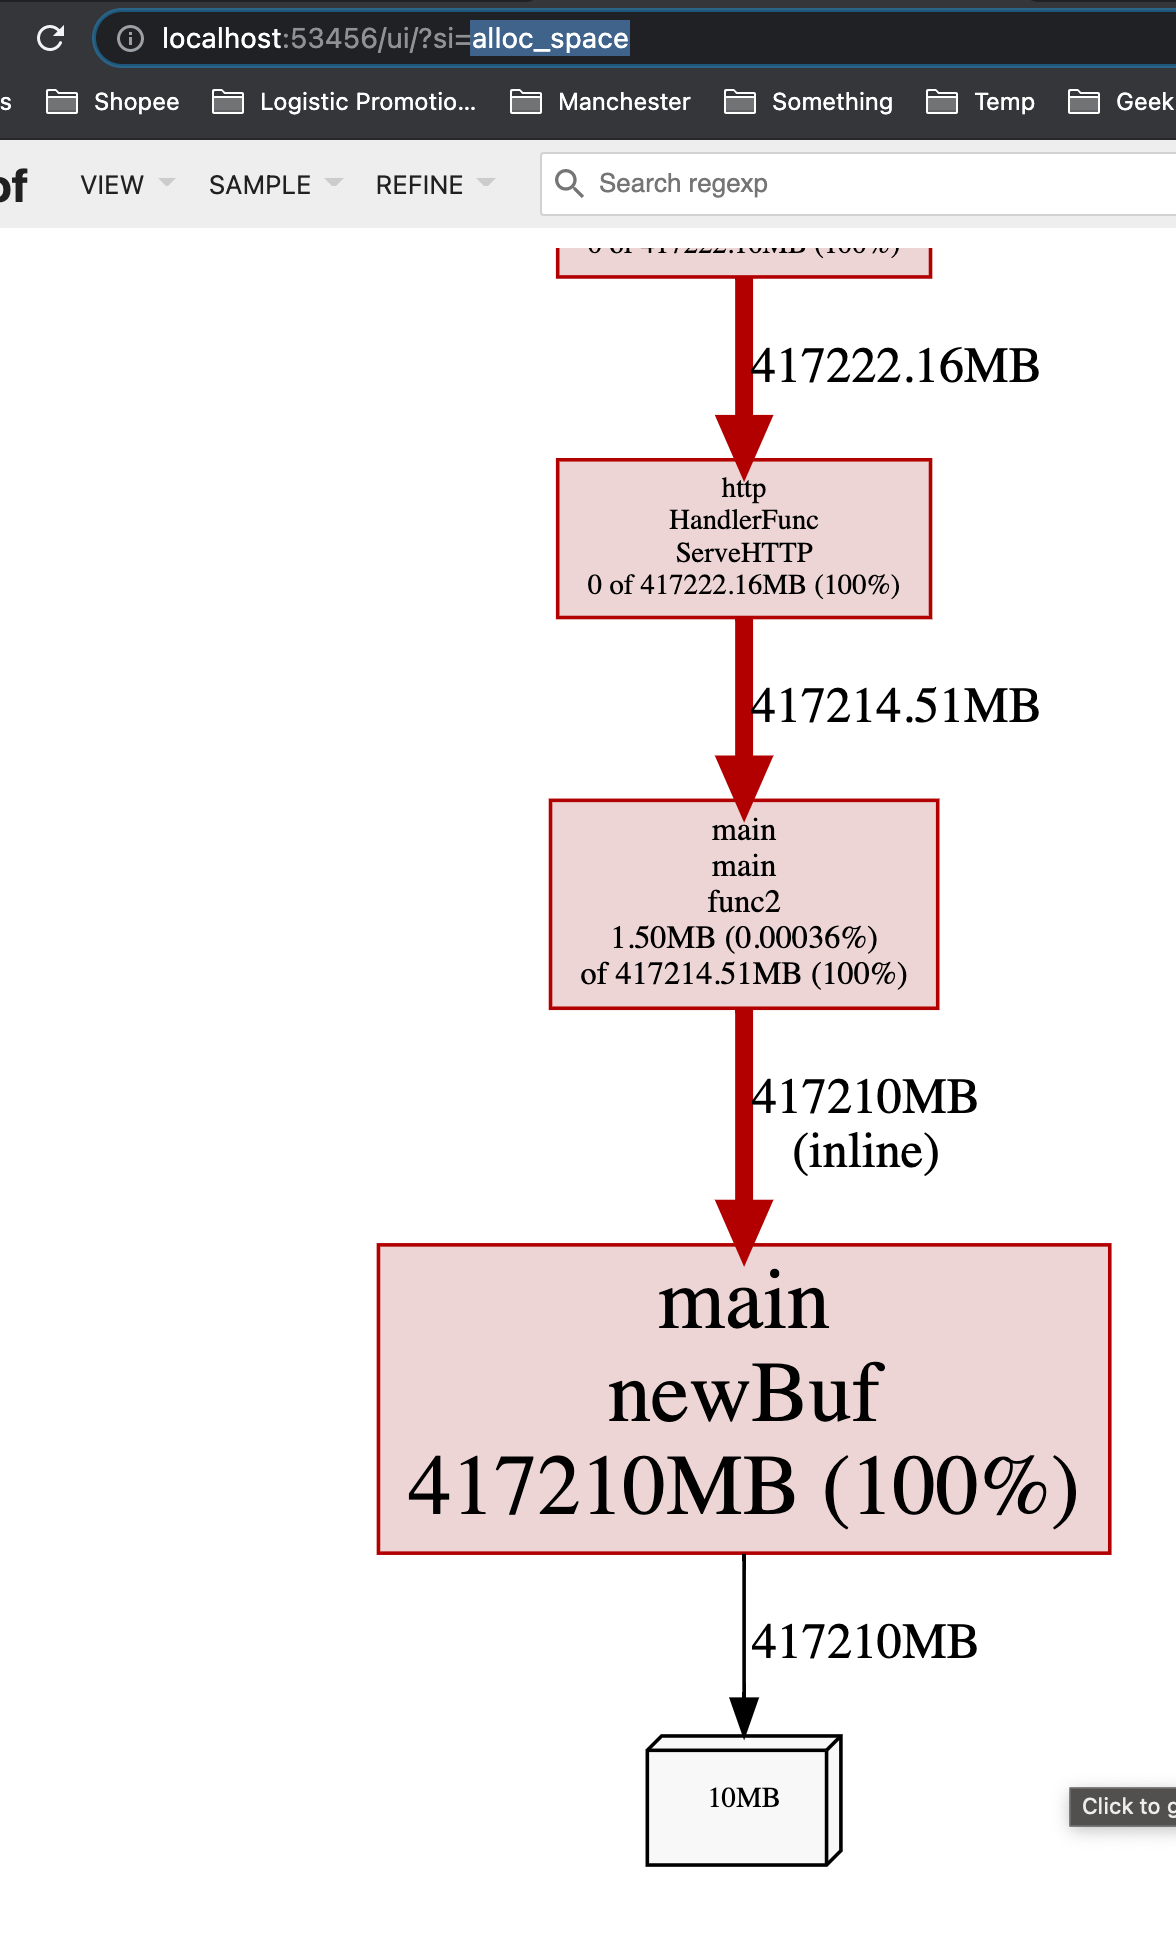
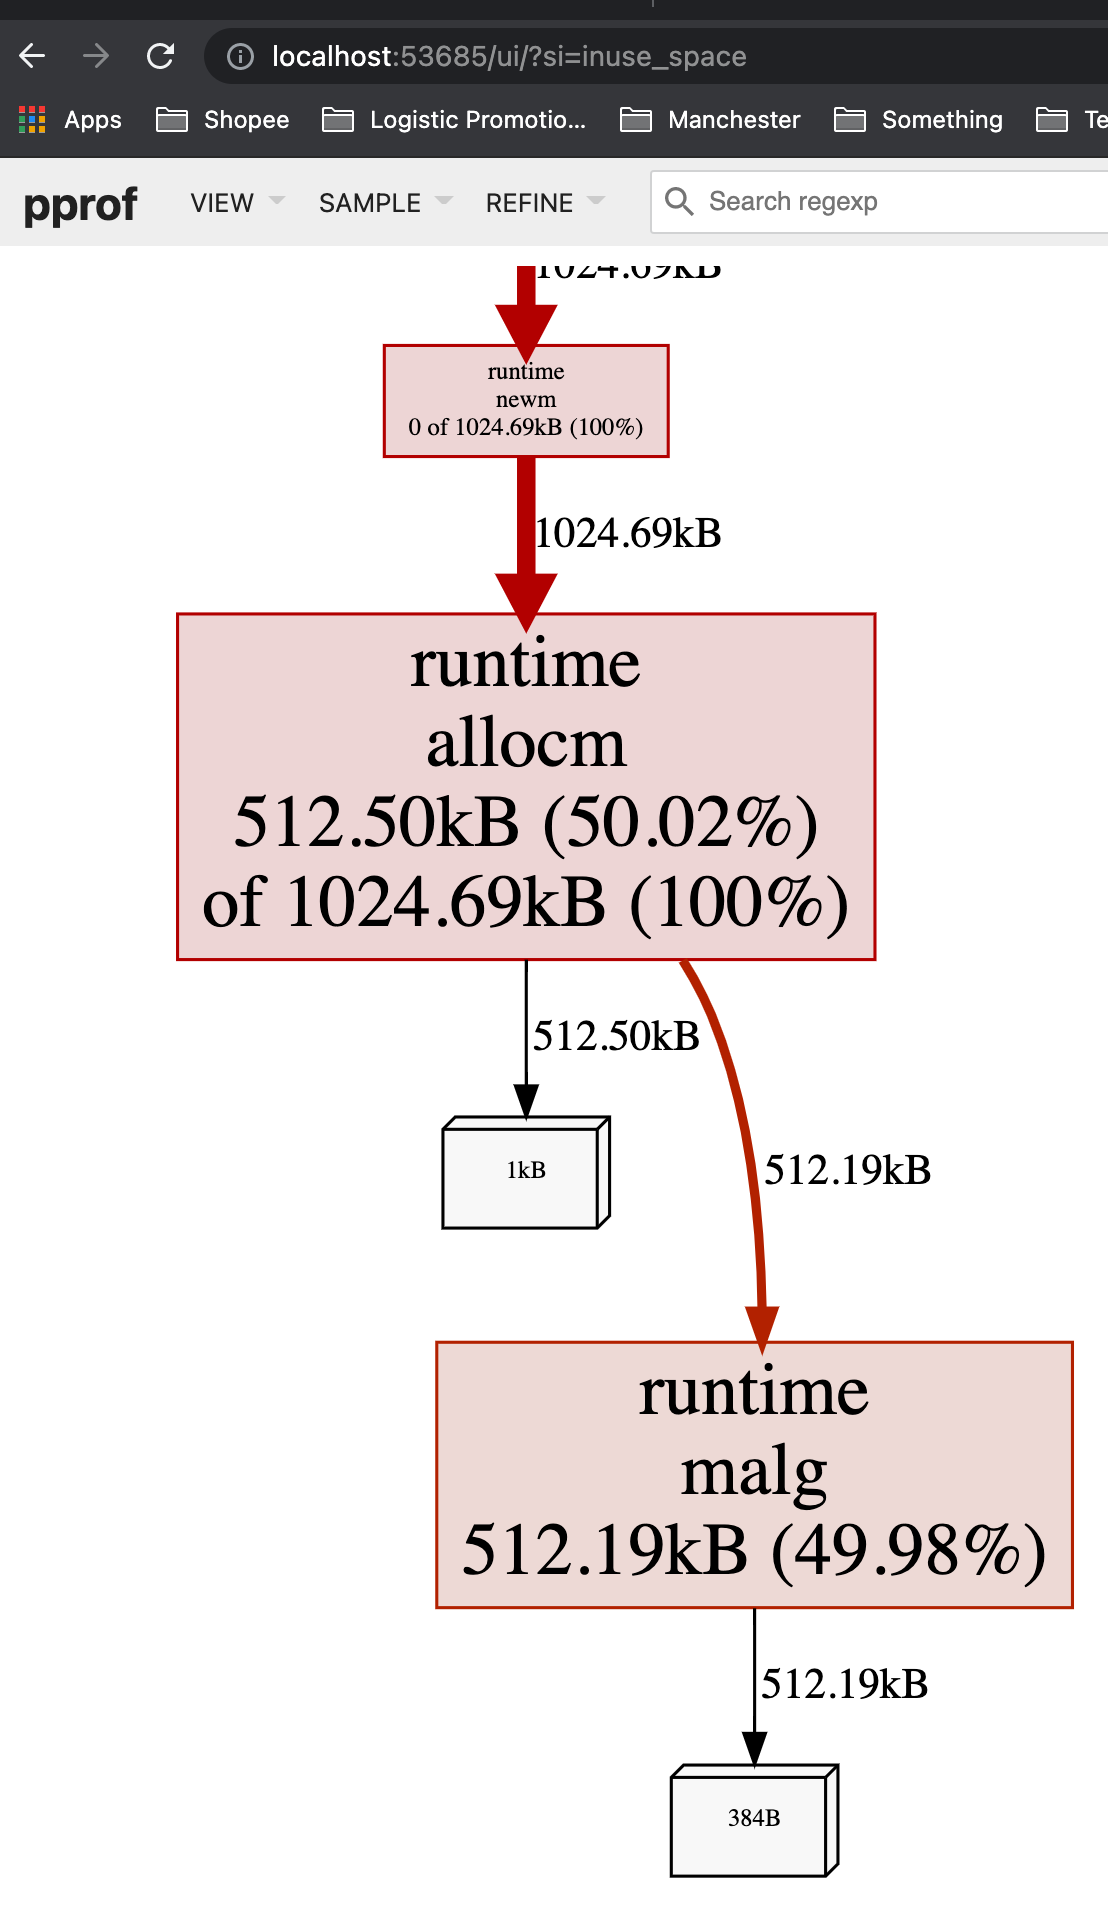
我们可以通过 go tool pprof 来查看究竟是谁分配了大量内存(alloc_space)。
$ go tool pprof -http : http://127.0.0.1:6060/debug/pprof/heap
Fetching profile over HTTP from http://127.0.0.1:6060/debug/pprof/heap
Saved profile in /Users/shiwei/pprof/pprof.alloc_objects.alloc_space.inuse_objects.inuse_space.003.pb.gz
Serving web UI on http://localhost:53456
从inuse_space来看也很高,这意味着这个app在运行时,如果一处理request,就会占用很大的内存:
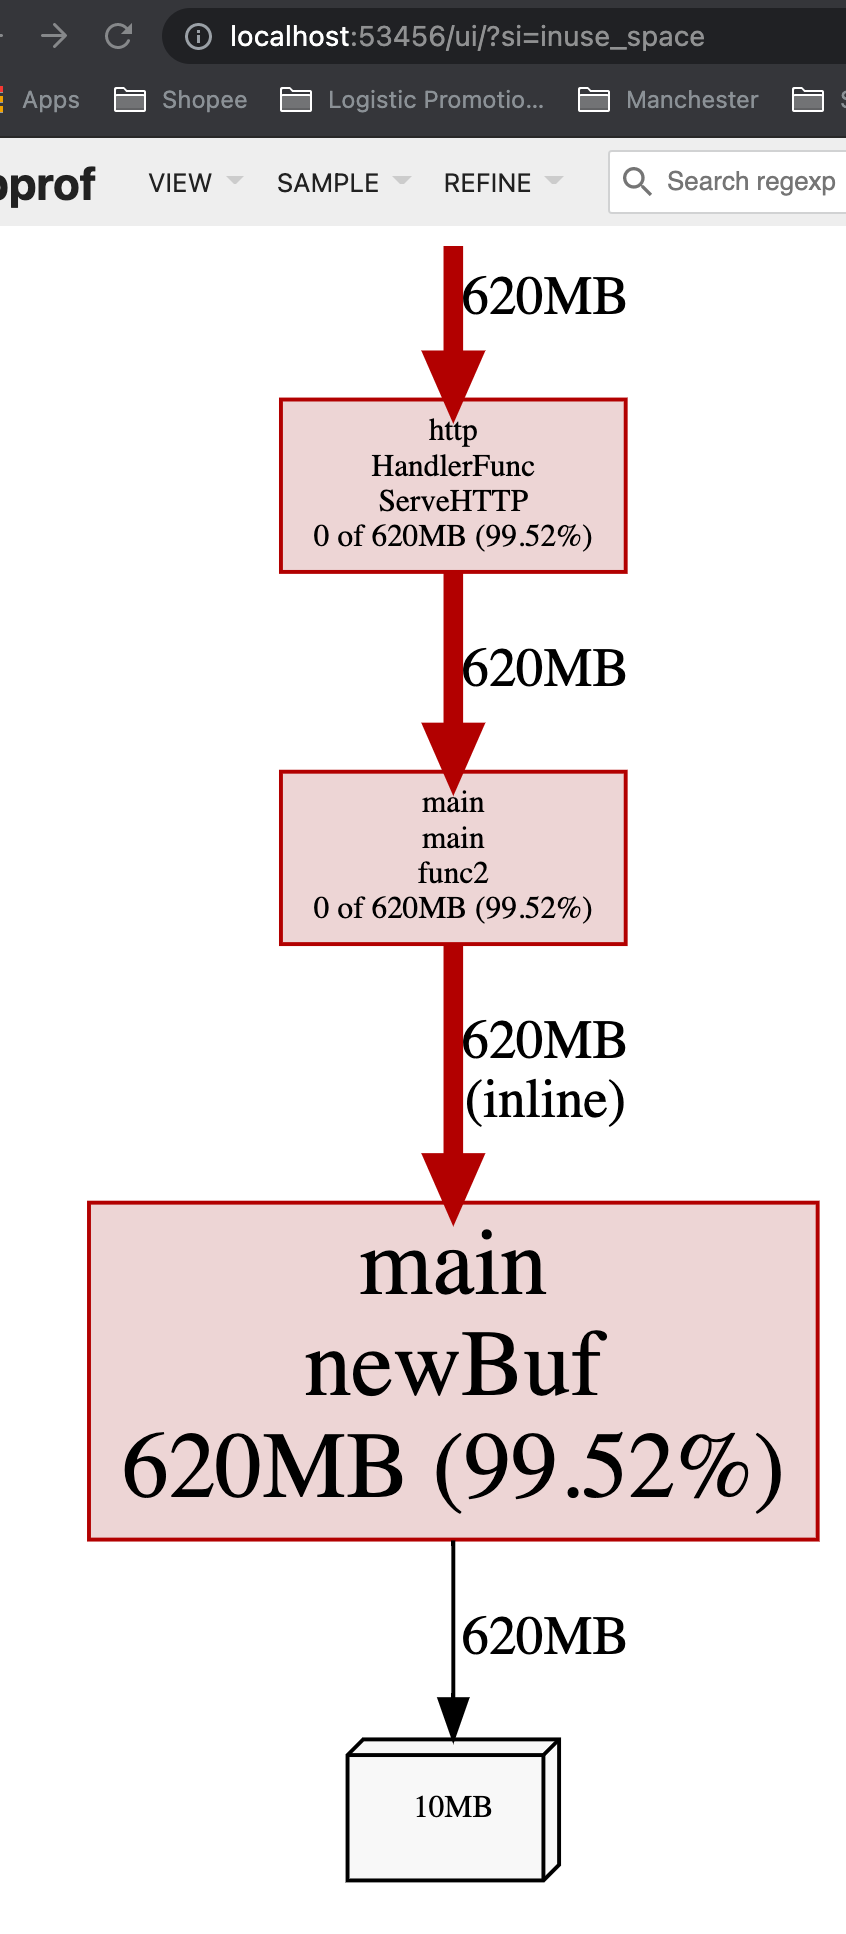
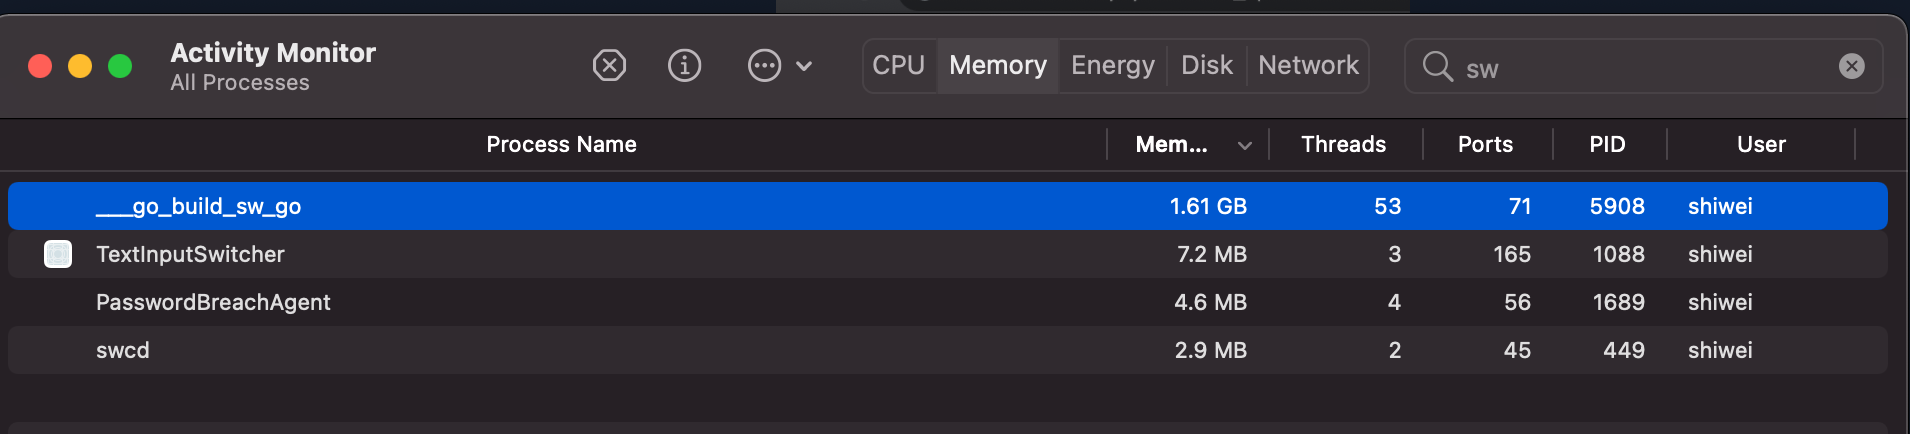
而在没有request到来的时候,内存占用率就会比较低:

这意味着,如果一个app随着throuput/QPS提高时,内存占用率大幅度提升,可能需要考虑减少每个request的内存创建,比如通过考虑object pool。
在我们这个case中,可见 newBuf 产生的申请的内存过多,现在我们使用 sync.Pool 来复用 newBuf 所产生的对象。
改进
package main

import (
	"fmt"
	"net/http"
	_ "net/http/pprof"
	"sync"
)

// 使用 sync.Pool 复用需要的 buf
var bufPool = sync.Pool{
	New: func() interface{} {
		return make([]byte, 10<<20)
	},
}

func main() {
	go func() {
		http.ListenAndServe("localhost:6060", nil)
	}()
	http.HandleFunc("/example2", func(w http.ResponseWriter, r *http.Request) {
		b := bufPool.Get().([]byte)
		for idx := range b {
			b[idx] = 0
		}
		fmt.Fprintf(w, "done, %v", r.URL.Path[1:])
		bufPool.Put(b)
	})
	http.ListenAndServe(":8080", nil)
}
$ ab -k -n 5000 -c 100 http://127.0.0.1:8080/example2
...
Requests per second:    1063.66 [#/sec] (mean)
Time per request:       94.015 [ms] (mean)
Time per request:       0.940 [ms] (mean, across all concurrent requests)
Transfer rate:          161.00 [Kbytes/sec] received

Connection Times (ms)
              min  mean[+/-sd] median   max
Connect:        0    0   0.3      0       3
Processing:     1   93 118.9     81    1681
Waiting:        1   93 118.9     80    1681
Total:          1   93 119.0     81    1681

...
可以看到,throughput 从 504.61 提高到了 1063.66,原因是因为更低频率的GC操作和花销更低的GC操作。实际上,在我们做trace的这5s中,并没有发生任何GC操作。
Reference
- https://golang.org/doc/diagnostics.html
- https://golang.org/cmd/trace/
- https://godoc.org/runtime/trace
- https://burxtx.github.io/2018/05/11/%E6%B7%B1%E5%85%A5%E6%B5%85%E5%87%BAGo%E8%AF%AD%E8%A8%80%E6%89%A7%E8%A1%8C%E8%B7%9F%E8%B8%AA/