Test Coverage
Test coverage is a term that describes how much of a package’s code is exercised by running the package’s tests. If executing the test suite causes 80% of the package’s source statements to be run, we say that the test coverage is 80%.
Example
package size

func Size(a int) string {
    switch {
    case a < 0:
        return "negative"
    case a == 0:
        return "zero"
    case a < 10:
        return "small"
    case a < 100:
        return "big"
    case a < 1000:
        return "huge"
    }
    return "enormous"
}
and this test:
package size

import "testing"

type Test struct {
    in  int
    out string
}

var tests = []Test{
    {-1, "negative"},
    {5, "small"},
}

func TestSize(t *testing.T) {
    for i, test := range tests {
        size := Size(test.in)
        if size != test.out {
            t.Errorf("#%d: Size(%d)=%s; want %s", i, test.in, size, test.out)
        }
    }
}
To get the test coverage for the package, we run the test with coverage enabled by providing the -cover flag to go test:
% go test ./... -cover
PASS
coverage: 42.9% of statements
ok  	size	0.026s
%
How Golang’s Test Coverage Tool Works
For the new test coverage tool for Go, we took a different approach that avoids dynamic debugging. The idea is simple: Rewrite the package’s source code before compilation to add instrumentation, compile and run the modified source, and dump the statistics. The rewriting is easy to arrange because the go command controls the flow from source to test to execution.
Here’s an example. Say we have a simple, one-file package like this:
package size

func Size(a int) string {
    switch {
    case a < 0:
        return "negative"
    case a == 0:
        return "zero"
    case a < 10:
        return "small"
    case a < 100:
        return "big"
    case a < 1000:
        return "huge"
    }
    return "enormous"
}
and this test:
package size

import "testing"

type Test struct {
    in  int
    out string
}

var tests = []Test{
    {-1, "negative"},
    {5, "small"},
}

func TestSize(t *testing.T) {
    for i, test := range tests {
        size := Size(test.in)
        if size != test.out {
            t.Errorf("#%d: Size(%d)=%s; want %s", i, test.in, size, test.out)
        }
    }
}
To get the test coverage for the package, we run the test with coverage enabled by providing the -cover flag to go test:
% go test -cover
PASS
coverage: 42.9% of statements
ok  	size	0.026s
%
Notice that the coverage is 42.9%, which isn’t very good. Before we ask how to raise that number, let’s see how that was computed.
When test coverage is enabled, go test runs the “cover” tool, a separate program included with the distribution, to rewrite the source code before compilation. Here’s what the rewritten Size function looks like:
func Size(a int) string {
    GoCover.Count[0] = 1
    switch {
    case a < 0:
        GoCover.Count[2] = 1
        return "negative"
    case a == 0:
        GoCover.Count[3] = 1
        return "zero"
    case a < 10:
        GoCover.Count[4] = 1
        return "small"
    case a < 100:
        GoCover.Count[5] = 1
        return "big"
    case a < 1000:
        GoCover.Count[6] = 1
        return "huge"
    }
    GoCover.Count[1] = 1
    return "enormous"
}
View Results
-coverprofile
The test coverage for our example was poor. To discover why, we ask go test to write a “coverage profile” for us, a file that holds the collected statistics so we can study them in more detail. That’s easy to do: use the -coverprofile flag to specify a file for the output:
% go test -coverprofile=coverage.out
PASS
coverage: 42.9% of statements
ok  	size	0.030s
%
(The -coverprofile flag automatically sets -cover to enable coverage analysis.) The test runs just as before, but the results are saved in a file. To study them, we run the test coverage tool ourselves, without go test. As a start, we can ask for the coverage to be broken down by function, although that’s not going to illuminate much in this case since there’s only one function:
% go tool cover -func=coverage.out
size.go:	Size          42.9%
total:      (statements)  42.9%
%
-html
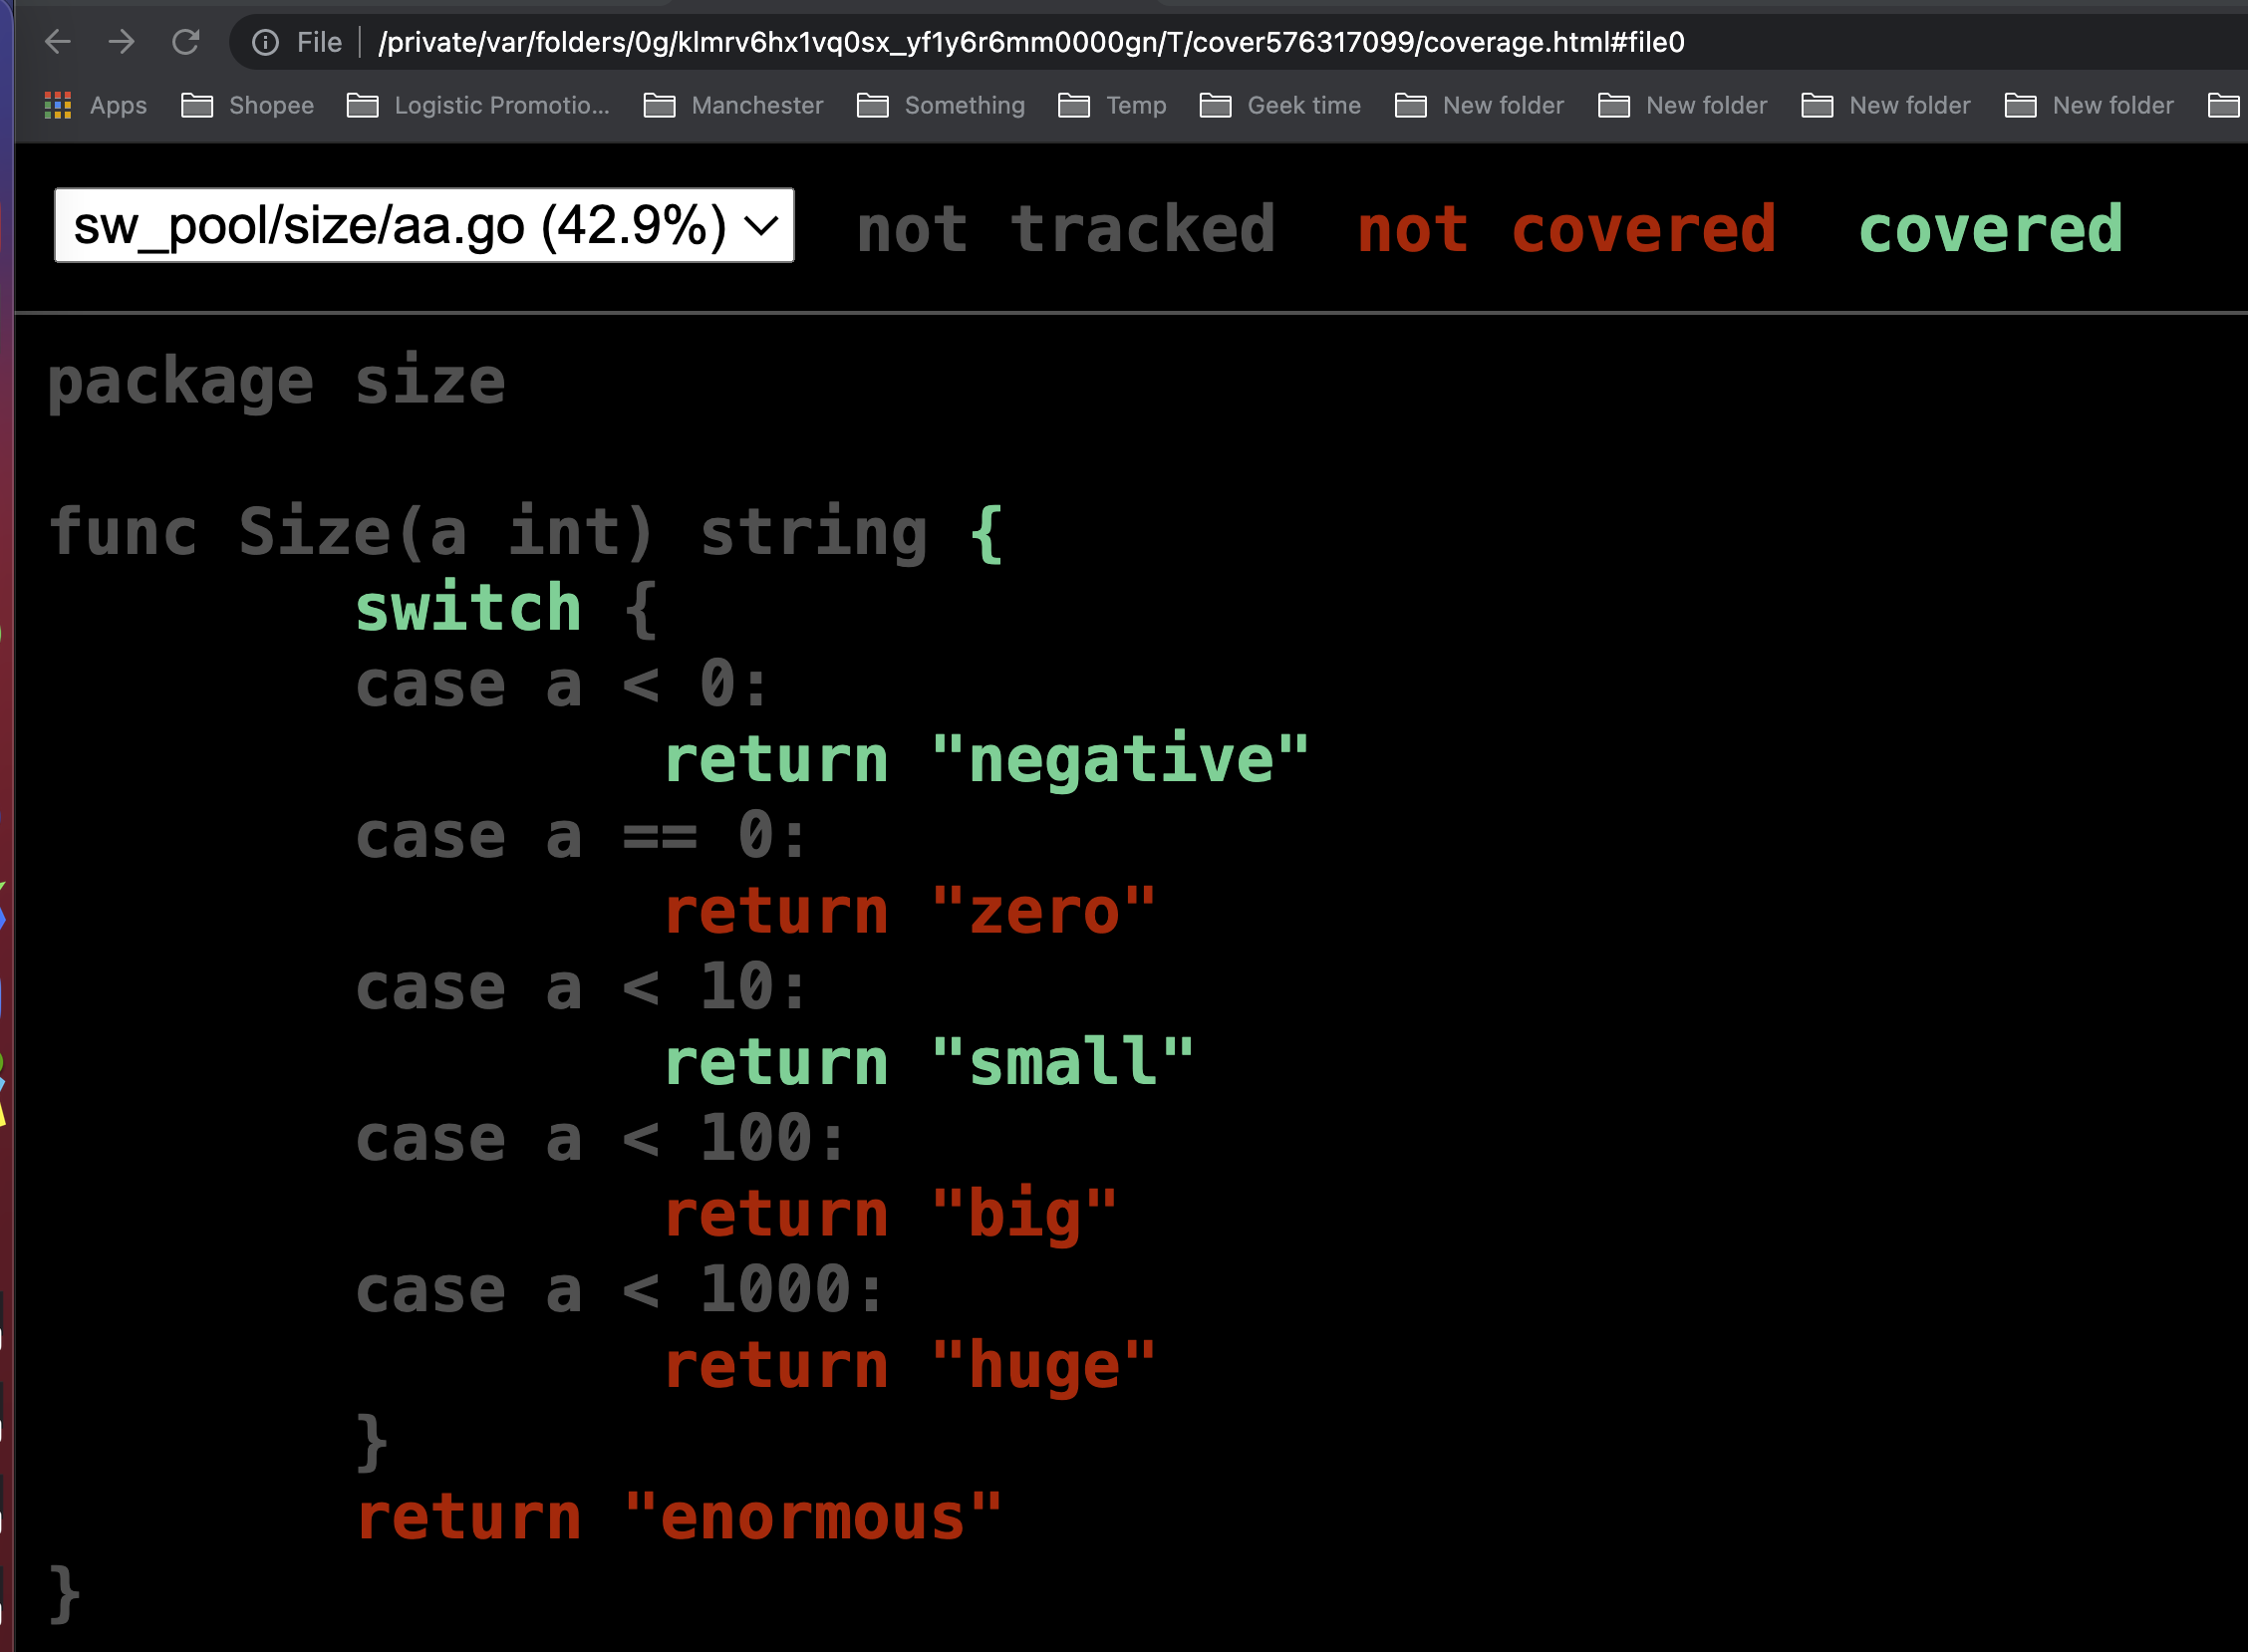
A much more interesting way to see the data is to get an HTML presentation of the source code decorated with coverage information. This display is invoked by the -html flag:
$ go tool cover -html=coverage.out
When this command is run, a browser window pops up, showing the covered (green), uncovered (red), and uninstrumented (grey) source. Here’s a screen dump:
Reference
- https://blog.golang.org/cover
- https://stackoverflow.com/questions/10516662/how-to-measure-test-coverage-in-go