Via anielqsj/kafka-exporter
Run Docker Image
docker run -tid --restart unless-stopped -p 9308:9308 danielqsj/kafka-exporter --kafka.server=192.168.18.129:9092
Grafana Dashboard
Grafana Dashboard ID: 7589, name: Kafka Exporter Overview.
For details of the dashboard please see Kafka Exporter Overview.
Via JMX Exporter
Download the JMX Exporter
$ cd /home/sw/kafka/libs; wget https://repo1.maven.org/maven2/io/prometheus/jmx/jmx_prometheus_javaagent/0.17.2/jmx_prometheus_javaagent-0.17.2.jar
Configure our Exporter
Next, we will have to configure our JMX Exporter for it to know what it will extract from Kafka. To explain this briefly, the configuration is a collection of regexps that names and filters the metrics to for Prometheus. Thanks to Prometheus, they have sample configurations in this GitHub repository. We will use kafka-2_0_0.yml sample configuration in this setup.
$ cd /home/sw/kafka/config; sudo vim sample_jmx_exporter.yml
Configure Kafka Broker to use the JMX exporter
Thus far we have everything that we need to start extracting Kafka metrics. The only thing remaining is to link the JMX exporter to our Kafka Broker. Without delay, let us get that done immediately. Open the Kafka Broker server start-up script and add the JMX configuration at the end of the file as shown below. All of the scripts are in the bin directory within Kafka’s home folder.
$ cd /home/sw/kafka/bin
$ sudo vim kafka-server-start.sh
#!/bin/bash
# Licensed to the Apache Software Foundation (ASF) under one or more
# contributor license agreements.  See the NOTICE file distributed with
# this work for additional information regarding copyright ownership.
# The ASF licenses this file to You under the Apache License, Version 2.0
# (the "License"); you may not use this file except in compliance with
# the License.  You may obtain a copy of the License at
#
#    http://www.apache.org/licenses/LICENSE-2.0
#
# Unless required by applicable law or agreed to in writing, software
# distributed under the License is distributed on an "AS IS" BASIS,
# WITHOUT WARRANTIES OR CONDITIONS OF ANY KIND, either express or implied.
# See the License for the specific language governing permissions and
# limitations under the License.

if [ $# -lt 1 ];
then
        echo "USAGE: $0 [-daemon] server.properties [--override property=value]*"
        exit 1
fi
base_dir=$(dirname $0)

if [ "x$KAFKA_LOG4J_OPTS" = "x" ]; then
    export KAFKA_LOG4J_OPTS="-Dlog4j.configuration=file:$base_dir/../config/log4j.properties"
fi

if [ "x$KAFKA_HEAP_OPTS" = "x" ]; then
    export KAFKA_HEAP_OPTS="-Xmx1G -Xms1G"
fi

EXTRA_ARGS=${EXTRA_ARGS-'-name kafkaServer -loggc'}

COMMAND=$1
case $COMMAND in
  -daemon)
    EXTRA_ARGS="-daemon "$EXTRA_ARGS
    shift
    ;;
  *)
    ;;
esac

exec $base_dir/kafka-run-class.sh $EXTRA_ARGS kafka.Kafka "$@"

### ADD THE LINE BELOW ###
export KAFKA_OPTS=' -javaagent:/home/sw/kafka/libs/jmx_prometheus_javaagent-0.17.2.jar=7075:/home/sw/kafka/config/sample_jmx_exporter.yml'
If you are using systemd, don’t need to do above, but add the line to kafka’s systemd file under [*Service*] section as an Environment as shown below:
$ sudo vim /etc/systemd/system/kafka.service
[Unit]
Requires=zookeeper.service
After=zookeeper.service

[Service]
Type=simple
User=kafka
##Add the line below
Environment="KAFKA_OPTS=-javaagent:/home/sw/kafka/libs/jmx_prometheus_javaagent-0.17.2.jar=7075:/home/sw/kafka/config/sample_jmx_exporter.yml"
ExecStart=/bin/sh -c '/home/sw/kafka/bin/kafka-server-start.sh /home/sw/kafka/config/server.properties > /home/sw/kafka/kafka.log 2>&1'
ExecStop=/home/sw/kafka/bin/kafka-server-stop.sh
Restart=on-abnormal

[Install]
WantedBy=multi-user.target
After adding the line at the end of the kafka-server-start.sh script or in the systemd file, restart Kafka broker.
sudo systemctl daemon-reload; sudo systemctl restart kafka.service
Check if the service was started by checking the existence of the port configured. If you have a firewall running and your Prometheus server is on a different server, then you should consider allowing access to this port.
$ sudo ss -tunelp | grep 7075
tcp    LISTEN     0      3      [::]:7075    [::]:*   users:(("java",pid=31609,fd=100)) uid:1000 ino:5391132 sk:ffff977c74f86b40 v6only:0 <->
Allow port on Firewall
### Ubuntu ###
sudo ufw allow 7075

### CentOS ###
sudo firewall-cmd --permanent --add-port=7075/tcp
sudo firewall-cmd --reload
Open your browser and point it to the IP or FQDN of your server and port. http://[IP or FQDN]:7075. You should see data metrics as shown below
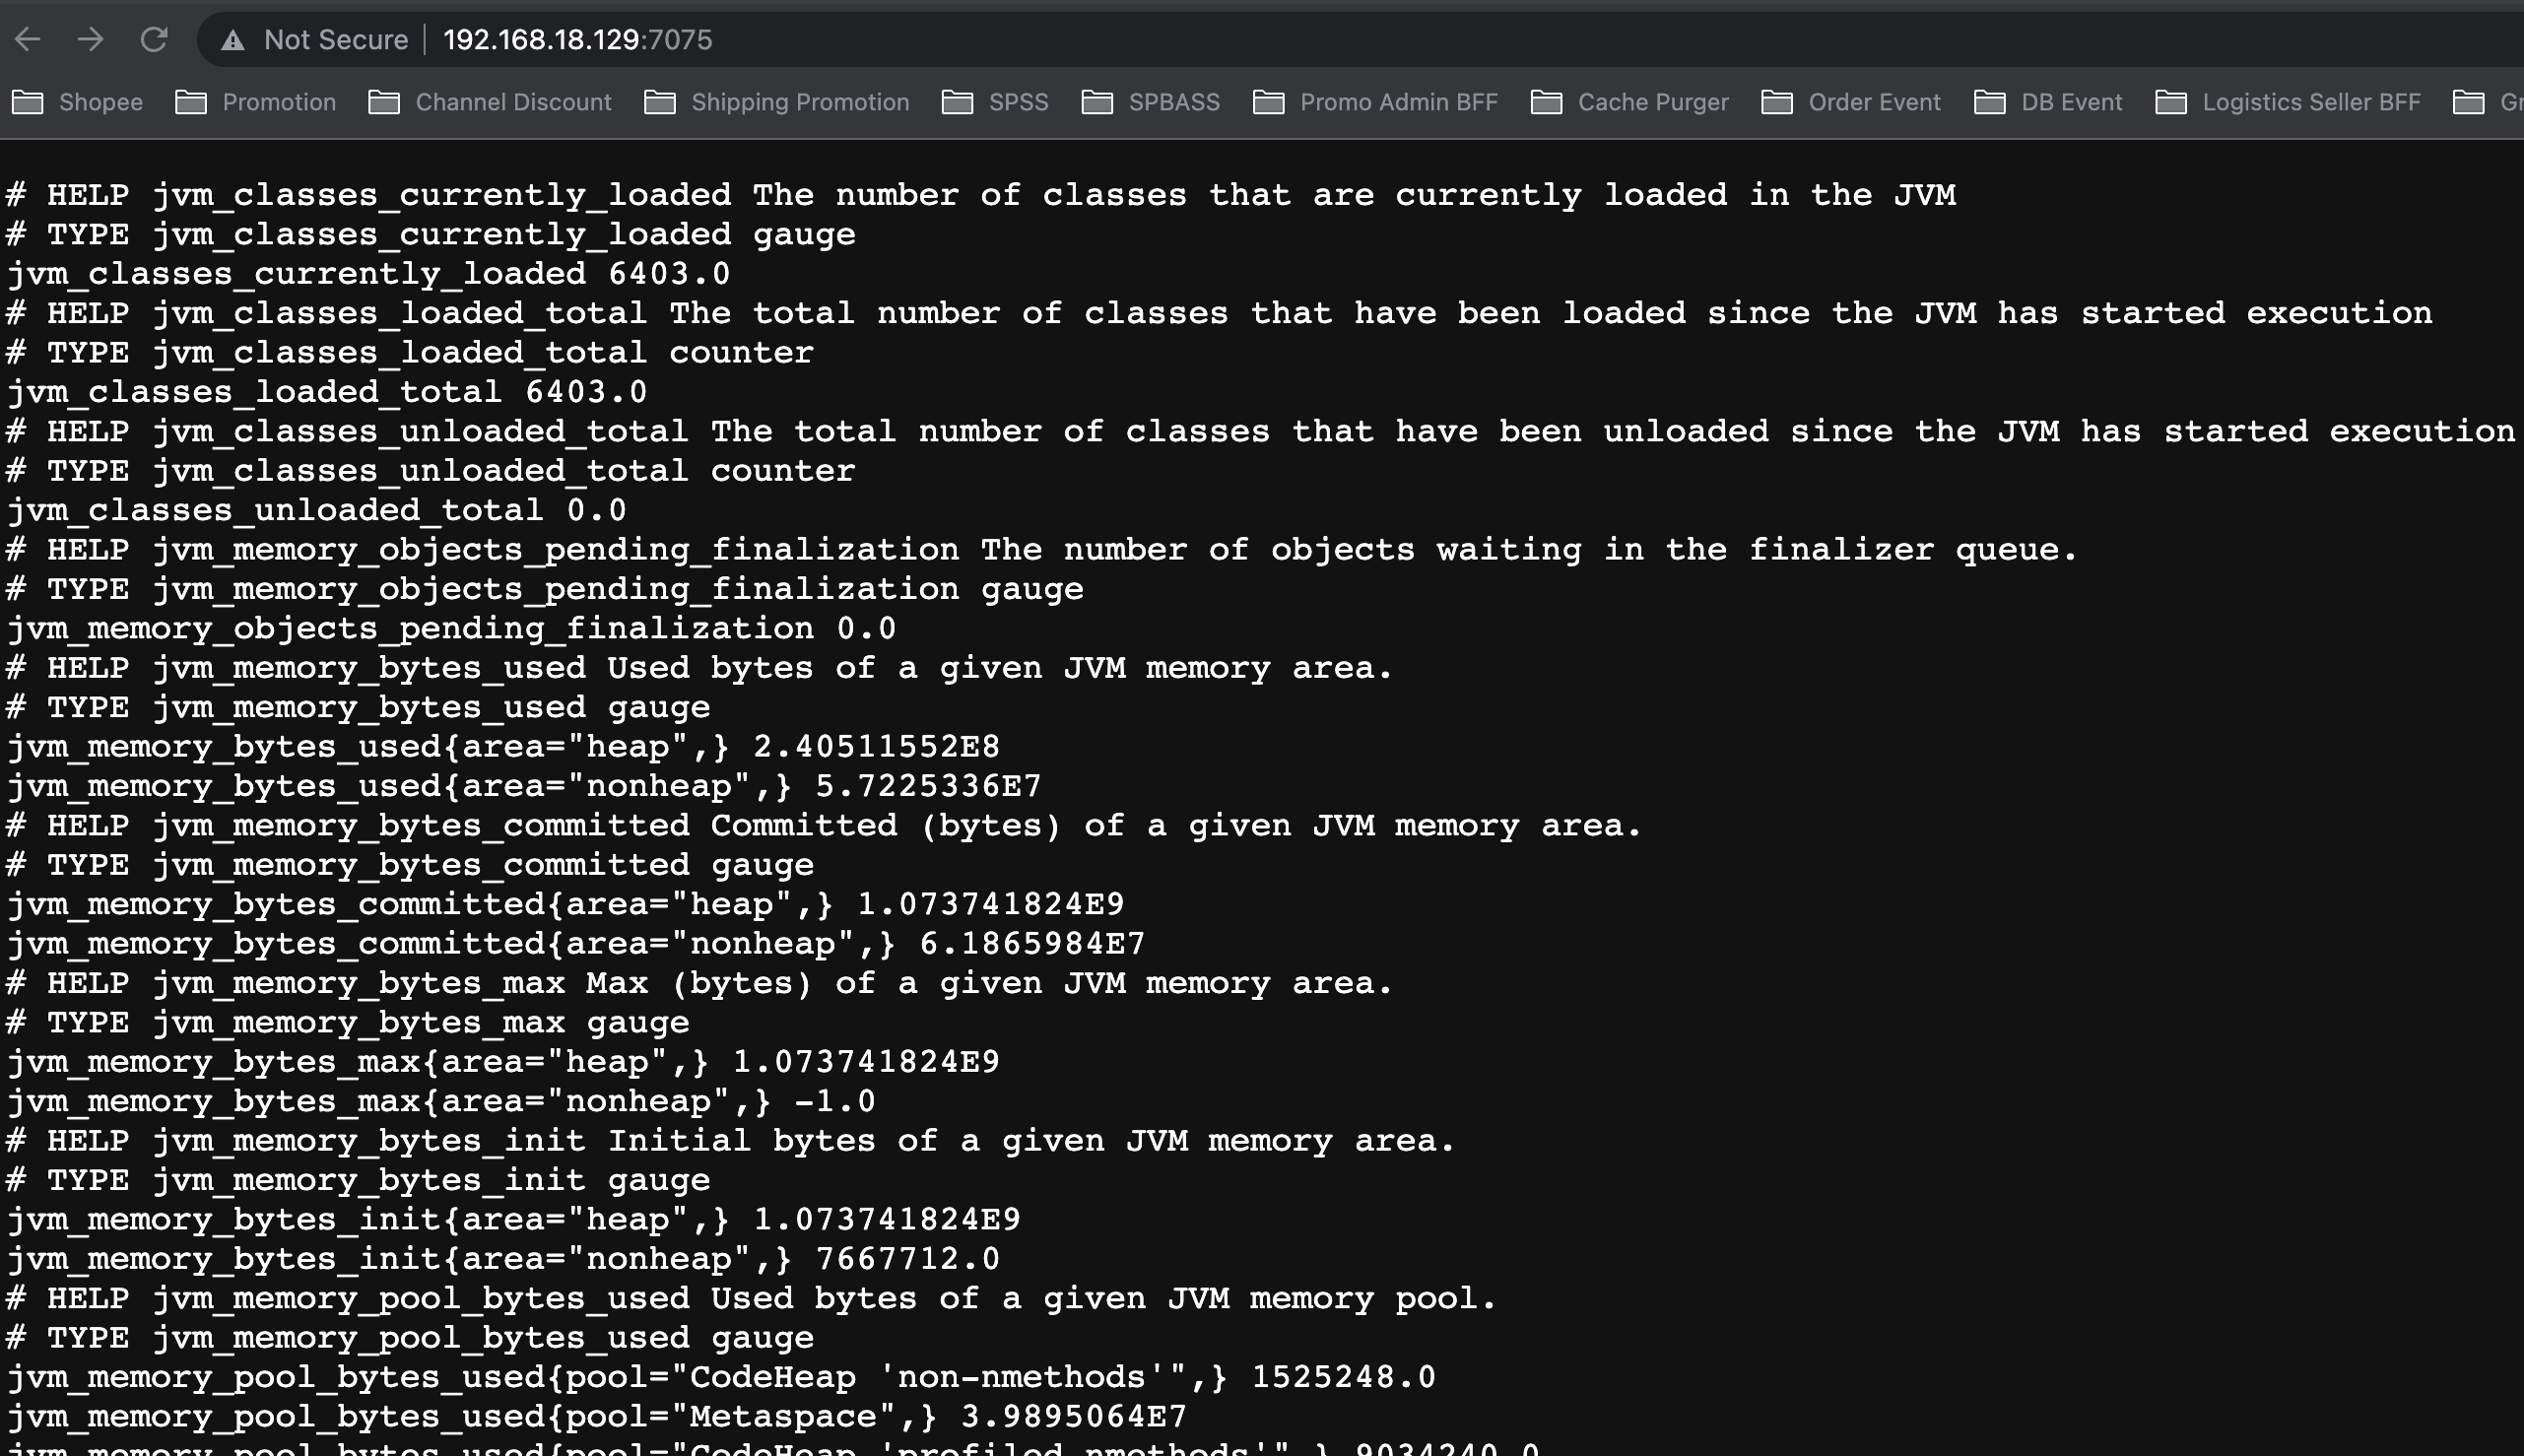
Good Stuff! Our JMX exporter is working as expected. Now let us move to add the data being exposed to Prometheus
Add Kafka data to Prometheus
$ sudo vim /home/sw/prometheus_config/prometheus.yml
##### CHANGE THE JOB NAME TO KAFKA AS BELOW#######
  - job_name: 'kafka'
    # metrics_path defaults to '/metrics'
    # scheme defaults to 'http'.
    #####CHANGE THE TARGET TO THE IP AND PORT OF JMX SERVICE JUST INSTALLED#######
    static_configs:
    - targets: ['192.168.18.129:7075']
You can confirm that this target has been successfully added in your Prometheus web interface. Open it up using your browser then click on *Status > Targets*. If successfully added, you should see it as illustrated below.
Add Kafka metrics to Grafana
Now we are on the last and the best part. Here, we shall add Prometheus as our data source then visualize it all with beautiful graphs and charts. Log into your Grafana web interface and proceed as follows. If you do not have Grafana installed, kindly us the guides below to get it up quickly.
Import Dashboard
After we are done adding the data source, we shall go on and add a dashboard that will visualize what is in the data source. While still on Grafana, click on the + button then select Import because we are going to use an already made dashboard created by Robust Perception. Its id is 721
Reference
- https://github.com/prometheus/jmx_exporter/tree/main/example_configs
- https://computingforgeeks.com/monitor-apache-kafka-with-prometheus-and-grafana/
- https://grafana.com/docs/grafana-cloud/data-configuration/integrations/integration-reference/integration-kafka/#:~:text=The%20Kafka%20integration%20for%20Grafana,%2C%20Schema%20Registry%2C%20and%20KSql.
- https://github.com/danielqsj/kafka_exporter