监控指标(Metrics to watch)
Tick频率(Tick frequency) - number of ticks per time
Tick周期(Tick Duration) - the time one tick takes
Active Handles and Requests
Garbbage Collection activity
-
CPU 使用(CPU Usage)
-
堆使用(Heap Usage)
-
内存使用(Memory usage)
-
吞吐量(Throughput)
-
响应时间(Response Time)
开源项目
Olegas/node-event-loop-monitor
bretcope/node-gc-profiler
Bnoordhuis/node-heapdump
内存泄漏
性能优化的好处
- 使用更少的内存
- 使用更少的CPU资源
- app运行更快
性能分析
场景1 - 长耗时的同步任务
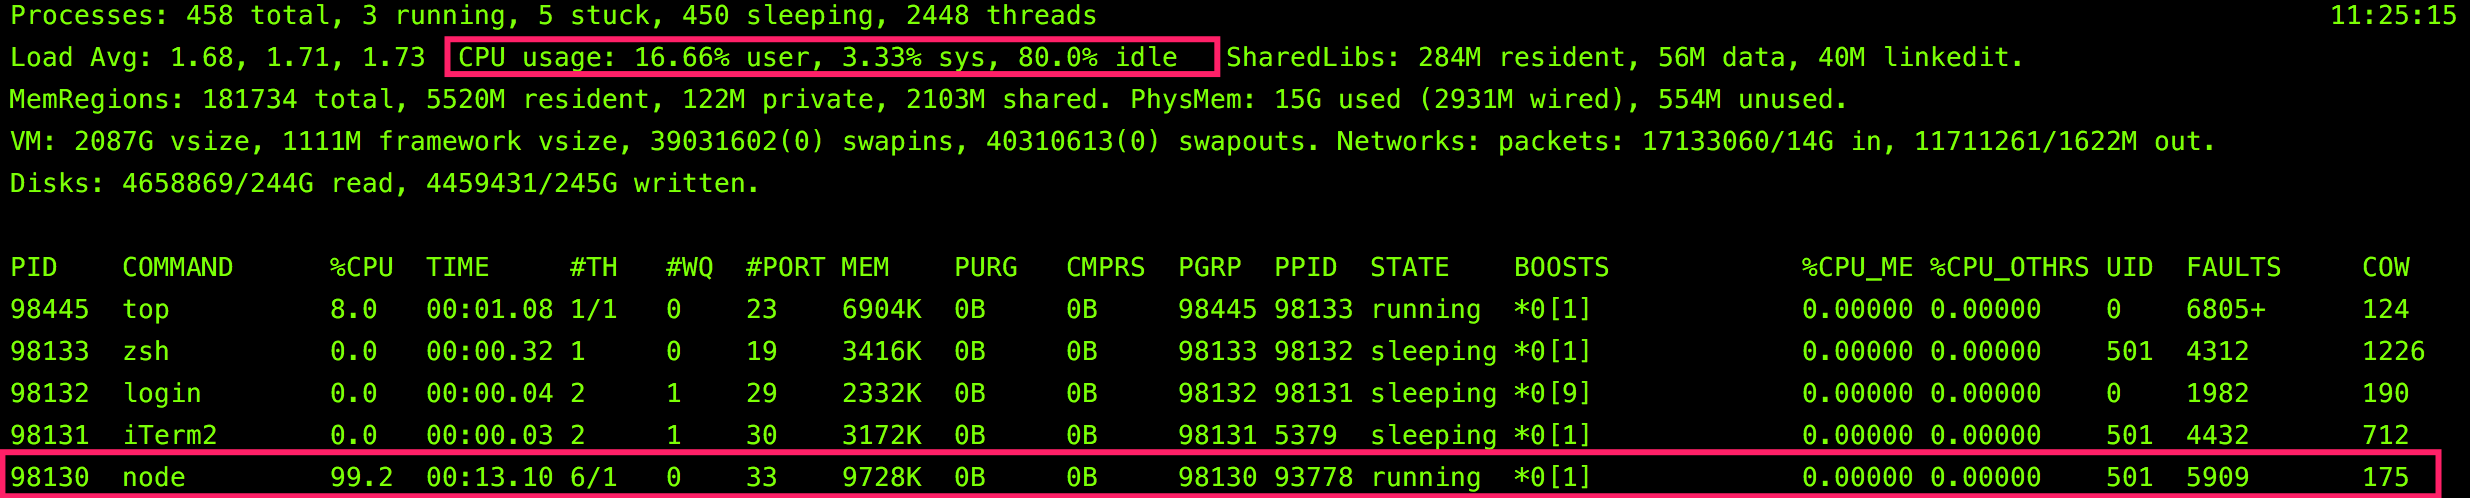
当Node应用具有很高的CPU使用率(CPU usage)时,表明此时在进行大量的同步任务,这意味着Event Loop 中的异步回调很有可能会被延迟执行。
function fibonacci(n) {
    if(n==0 || n == 1)
        return n;
    return fibonacci(n-1) + fibonacci(n-2);
}

var timeoutScheduled = Date.now();

var result=fibonacci(45);
const delay = Date.now() - timeoutScheduled;
console.log("finish fibonacci");
console.log(`${delay}ms fibonacci`);


setTimeout(() => {
  const delay = Date.now() - timeoutScheduled;

  console.log('setTimeout');
  console.log(`${delay}ms setTimeout`);
}, 5);

setImmediate(() => {
	const delay = Date.now() - timeoutScheduled;

  console.log('setImmediate1');
  console.log(`${delay}ms setImmediate1`);
});

setImmediate(() => {
	const delay = Date.now() - timeoutScheduled;

  console.log('setImmediate2');
  console.log(`${delay}ms setImmediate2`);
});

process.nextTick(() => {
  const delay = Date.now() - timeoutScheduled;

  console.log('process.nextTick');
  console.log(`${delay}ms process.nextTick`);
});
执行结果
$ node main.js
finish fibonacci
12421ms fibonacci
process.nextTick
12424ms process.nextTick
setImmediate1
12425ms setImmediate1
setImmediate2
12425ms setImmediate2
setTimeout
12429ms setTimeout
分析
可以看到,同步任务fibonacci执行了12421ms,所有的异步回调都被阻塞了,直到这个同步任务完成后,才依次被执行。
同时,该node进程的CPU使用率为几乎100%,而整机的CPU的使用率却相对非常低(空闲率为80%),这是因为这个fibonacci同步任务仅仅在一个线程中执行,因此无法充分利用多核CPU的计算能力。
判断异步回调是否被阻塞,Tick频率或Tick周期是一个最简单的判断指标。
场景2 - 大量同步任务调用
上一种场景,是针对Node应用具有很高的CPU使用率(CPU usage)。而当应用的CPU使用率很低时,却并不意味着Event Loop 中的异步回调没有被大量延迟执行。
一个典型的例子,就是Node代码中存在大量的同步IO操作,比如fs.readFileSync()的调用
总结
阻塞后的Event Loop体现出高延迟低空闲(High event loop lag, low event loop idle)的特点。
典型的阻塞Event Loop的 Node API调用分类成两种情况:
同步的CPU密集型操作
- 加密操作 -
Crypto模块中crypto.pbkdf2()crypto.randomBytes()`` crypto.randomFill()方法 - 压缩操作 -
Zlib模块中没有显式使用libuv线程池进行同步调用的方法
同步的IO密集型操作
DNS模块中的dns.lookup()和dns.lookupService()File System模块中 除了fs.FSWatcher()和那些没有显式使用libuv线程池进行同步调用的方法
找到event loop的Tick Duration增加的原因,是优化Node应用的一个关键。而将这些同步的API调用放到Node中工作池(Worker Pool)中,是一个有效的解决办法。
场景3 - 内存泄漏
http://pmuellr.github.io/slides/2017/01-profiling-node/demos/express-demo.js.html
工具
profiler inside V8
https://nodejs.org/en/docs/guides/simple-profiling/
Node Application Metrics
Node Application Metrics (https://github.com/RuntimeTools/appmetrics)是一个由IBM开发的专门针对Node.js应用的性能资源监测数据采集工具。
在数据采集完成后,可以通过Node Application Metrics Dashboard(https://github.com/RuntimeTools/appmetrics-dash)将性能指标(Performance Metrics)可视化显示。
Node Application Metrics收集的原始数据包括:
| Source | Description |
|---|---|
| Environment | Machine and runtime environment information |
| CPU | Process and system CPU |
| Memory | Process and system memory usage |
| GC | Node/V8 garbage collection statistics |
| Event Loop | Event loop latency information |
| Loop | Event loop timing metrics |
| Function profiling | Node/V8 function profiling (disabled by default) |
| HTTP | HTTP request calls made of the application |
| HTTP Outbound | HTTP requests made by the application |
| socket.io | WebSocket data sent and received by the application |
| LevelDB | LevelDB queries made by the application |
| MySQL | MySQL queries made by the application |
| MongoDB | MongoDB queries made by the application |
| PostgreSQL | PostgreSQL queries made by the application |
| MQTT | MQTT messages sent and received by the application |
| MQLight | MQLight messages sent and received by the application |
| Memcached | Data that is stored or manipulated in Memcached |
| OracleDB | OracleDB queries made by the application |
| Oracle | Oracle queries made by the application |
| StrongOracle | StrongOracle database queries made by the application |
| Redis | Redis commands issued by the application |
| Riak | Riak methods called by the application |
| Request tracking | A tree of application requests, events and optionally trace (disabled by default) |
| Function trace | Tracing of application function calls that occur during a request (disabled by default) |
Application Metrics for Node.js
npm install -S appmetrics-dash

# In your Node.js application, add:
require('appmetrics-dash').monitor();

# Monitor your running Node.js application in a web browser at:
localhost:3001/appmetrics-dash
easy-monitor
npm install express
npm install easy-monitor
main.js
'use strict';
const easyMonitor = require('easy-monitor');
easyMonitor('Mercury');
const express = require('express');
const app = express();

app.get('/hello', function (req, res, next) {
    res.send('hello');
});

app.listen(8082);
Node Report
https://www.npmjs.com/package/node-report
NodeSource N|Solid Platform
https://nodesource.com/products/nsolid
https://docs.nodesource.com/nsolid/3.4/docs#console-overview
npm module v8-profiler
https://www.youtube.com/watch?v=gL2GGcV_f20
V8 Inspector
- 分析函数执行时间 - V8 CPU profiler
- 找到应用中的瓶颈(bottleneck)
- 优化应用性能
- 分析内存使用 - V8 heap snapshots profiler
- 发现内存泄漏
- 优化程序的内存使用
Reference
https://nodejs.org/en/docs/guides/dont-block-the-event-loop/
https://nodesource.com/blog/node-js-performance-monitoring-part-3-debugging-the-event-loop/
https://blog.ghaiklor.com/profiling-nodejs-applications-1609b77afe4e
https://blog.risingstack.com/monitoring-nodejs-applications-nodejs-at-scale/
https://blog.appdynamics.com/product/top-5-performance-metrics-for-node-js-applications/
https://www.youtube.com/watch?v=9RhOGoChGqo
http://pmuellr.github.io/slides/2017/01-profiling-node/#24
http://pmuellr.github.io/slides/2016/01-intro-to-profiling/intro-to-profiling.pdf