联邦集群+HA
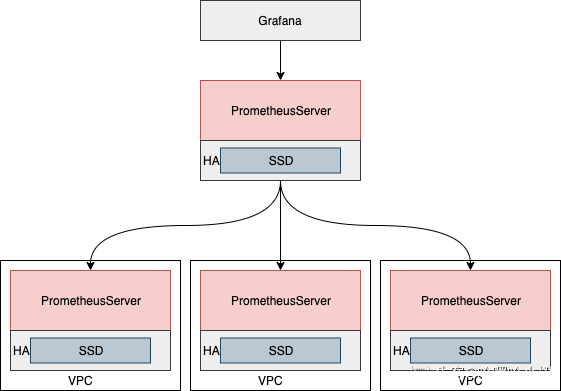
通常Prometheus高可用部署方案为联邦集群+HA的方式部署,如图所示:

在联邦+HA部署中,在每个数据中心或者VPC内以HA的方式进行Prometheus Server部署,采集当前所在数据中心或VPC内的监控目标数据,然后由一个全局的Prometheus Server负责聚合多个数据中心或VPC的监控数据,提供统一接口给用户查询,这样的部署架构看似满足高可用,但也存在诸多问题。
- HA双副本或者更多副本运行的Prometheus Server收集的数据如何去重?
- 副本故障或副滚动升级造成数据出现断点,如何将多个副本数据进行互补,保证监控数据完整性?
- 中心Prometheus Server既要收集全局监控数据,又要提供给用户查询。
- 如何把控中心Server的负载 ? b.如何将监控数据高性能的方式提供给企业内部其它团队进行查询和汇聚?
- 各数据中心监控数据如何长期存放?那么如何部署Prometheus,能够解决如上问题呢?
Prometheus Thanos

Components
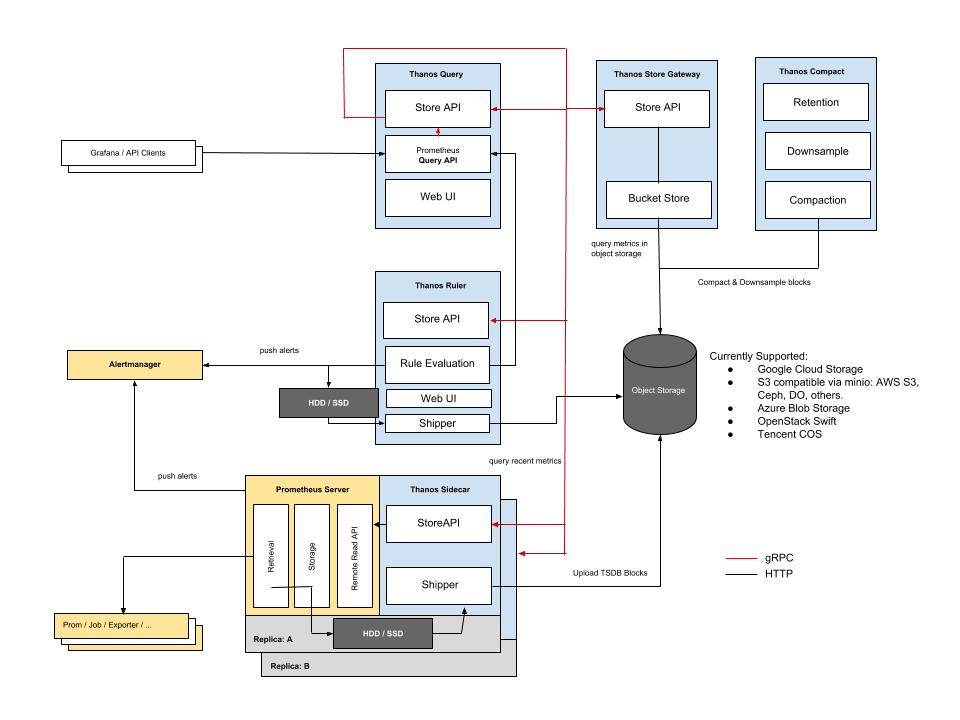
Following the KISS and Unix philosophies, Thanos is made of a set of components with each filling a specific role.
- Sidecar: connects to Prometheus, reads its data for query and/or uploads it to cloud storage.
- Store Gateway: serves metrics inside of a cloud storage bucket.
- Compactor: compacts, downsamples and applies retention on the data stored in cloud storage bucket.
- Receiver: receives data from Prometheus’s remote-write WAL, exposes it and/or upload it to cloud storage.
- Ruler/Rule: evaluates recording and alerting rules against data in Thanos for exposition and/or upload.
- Querier/Query: implements Prometheus’s v1 API to aggregate data from the underlying components.
Sidecar
主要是用来部署在每一个Prometheus实例所在的服务器或者Pod上,上传prometheus TSDB 的chunks存储块至OSS上或者其他的对对象存储桶上,同时接收Query组件转发的指标查询请求。
Thanos integrates with existing Prometheus servers through a Sidecar process, which runs on the same machine or in the same pod as the Prometheus server.
The purpose of the Sidecar is to backup Prometheus data into an Object Storage bucket, and give other Thanos components access to the Prometheus metrics via a gRPC API.
External storage
The following configures the sidecar to write Prometheus’s data into a configured object storage:
thanos sidecar \
    --tsdb.path            /var/prometheus \          # TSDB data directory of Prometheus
    --prometheus.url       "http://localhost:9090" \  # Be sure that the sidecar can use this url!
    --objstore.config-file bucket_config.yaml \       # Storage configuration for uploading data
Store API
实现了对象存储上历史数据查询的API。
The Sidecar component implements and exposes a gRPC Store API. The sidecar implementation allows you to query the metric data stored in Prometheus.
Let’s extend the Sidecar in the previous section to connect to a Prometheus server, and expose the Store API.
Querier/Query
实现了Prometheus HTTP v1 的API查询接口,接收用户指标查询请求,根据不同的label把请求转发至相应的Sidecar和Store ,聚合查询结果,并通过gossip协议去重,将结果返回给用户,同时可以将同一prometheus多副本滚动升级或者副本故障后造成的数据断点进行多副本数据聚合,返回正确数据给用户。
Now that we have setup the Sidecar for one or more Prometheus instances, we want to use Thanos’ global Query Layer to evaluate PromQL queries against all instances at once.
The Query component is stateless and horizontally scalable and can be deployed with any number of replicas. Once connected to the Sidecars, it automatically detects which Prometheus servers need to be contacted for a given PromQL query.
Thanos Querier also implements Prometheus’s official HTTP API and can thus be used with external tools such as Grafana. It also serves a derivative of Prometheus’s UI for ad-hoc querying and stores status.
Reference
- https://github.com/thanos-io/thanos
- https://thanos.io/tip/thanos/quick-tutorial.md/
- https://blog.nowcoder.net/n/b641d43db0934d428fd6fb2dacdad6ac