Recording Rules
Prometheus supports two types of rules which may be configured and then evaluated at regular intervals: recording rules and alerting rules. To include rules in Prometheus, create a file containing the necessary rule statements and have Prometheus load the file via the rule_files field in the Prometheus configuration. Rule files use YAML.
Recording rules allow you to precompute frequently needed or computationally expensive expressions and save their result as a new set of time series. Querying the precomputed result will then often be much faster than executing the original expression every time it is needed. This is especially useful for dashboards, which need to query the same expression repeatedly every time they refresh.
Recording and alerting rules exist in a rule group. Rules within a group are run sequentially at a regular interval.
Config
$ nano prometheus_rules.yml
groups:
  - name: custom_rules
    rules:
      - record: node_memory_MemFree_percent
        expr: 100 - (100 * node_memory_MemFree_bytes / node_memory_MemTotal_bytes)

      - record: node_filesystem_free_percent
        expr: 100 * node_filesystem_free_bytes{mountpoint="/"} / node_filesystem_size_bytes{mountpoint="/"}
The rules field specify all the recording rules added, I have added 2 recording rules one for free node memory percentage and another for free node filesystem percentage. The expr field holds the actual expression.
Config
The syntax of a rule file is:
groups:
  [ - <rule_group> ]
<rule_group>
# The name of the group. Must be unique within a file.
name: <string>

# How often rules in the group are evaluated.
[ interval: <duration> | default = global.evaluation_interval ]

# Limit the number of alerts an alerting rule and series a recording
# rule can produce. 0 is no limit.
[ limit: <int> | default = 0 ]

rules:
  [ - <rule> ... ]
<rule>
The syntax for recording rules is:
# The name of the time series to output to. Must be a valid metric name.
record: <string>

# The PromQL expression to evaluate. Every evaluation cycle this is
# evaluated at the current time, and the result recorded as a new set of
# time series with the metric name as given by 'record'.
expr: <string>

# Labels to add or overwrite before storing the result.
labels:
  [ <labelname>: <labelvalue> ]
Example
A simple example rules file would be:
$ vim prometheus_rules.yml
groups:
  - name: custom_rules
    rules:
      - record: node_memory_MemFree_percent
        expr: 100 - (100 * node_memory_MemFree_bytes / node_memory_MemTotal_bytes)
Verify Rule Config File
Once we have created the recording rules, we need to check if the rules have any faults or syntax errors or indentation problem, we can execute this command to verify.
# seems throw an error
$ go get github.com/prometheus/prometheus/cmd/promtool
# or on masOS
$ brew install prometheus
# on Ubuntu
$ sudo apt-get install prometheus

$ promtool check rules prometheus_rules.yml
Checking 1.yml
  SUCCESS: 1 rules found
$ promtool check config prometheus.yml
Checking prometheus.yml
  SUCCESS: 1 rule files found

Checking prometheus_rules.yml
  SUCCESS: 1 rules found
Once we see the SUCCESS message then we need to add the rules configuration in the prometheus config file. It’s pretty easy and straight forward, we just add the name of the recording rules file in prometheus.yml file under the field rule_files:
# my global config
global:
  scrape_interval:     15s # Set the scrape interval to every 15 seconds. Default is every 1 minute.
  evaluation_interval: 15s # Evaluate rules every 15 seconds. The default is every 1 minute.
  # scrape_timeout is set to the global default (10s).

rule_files:
  - "prometheus_rules.yml"

scrape_configs:
  # The job name is added as a label `job=<job_name>` to any timeseries scraped from this config.
  - job_name: 'prometheus'

    # metrics_path defaults to '/metrics'
    # scheme defaults to 'http'.

    static_configs:
    - targets: ['localhost:9090']
  - job_name: 'node_exporter'

    # metrics_path defaults to '/metrics'
    # scheme defaults to 'http'.

    static_configs:
    - targets: ['localhost:9100','18.237.17.50:9100','34.221.251.128:9100']
Restart Prometheus Server.
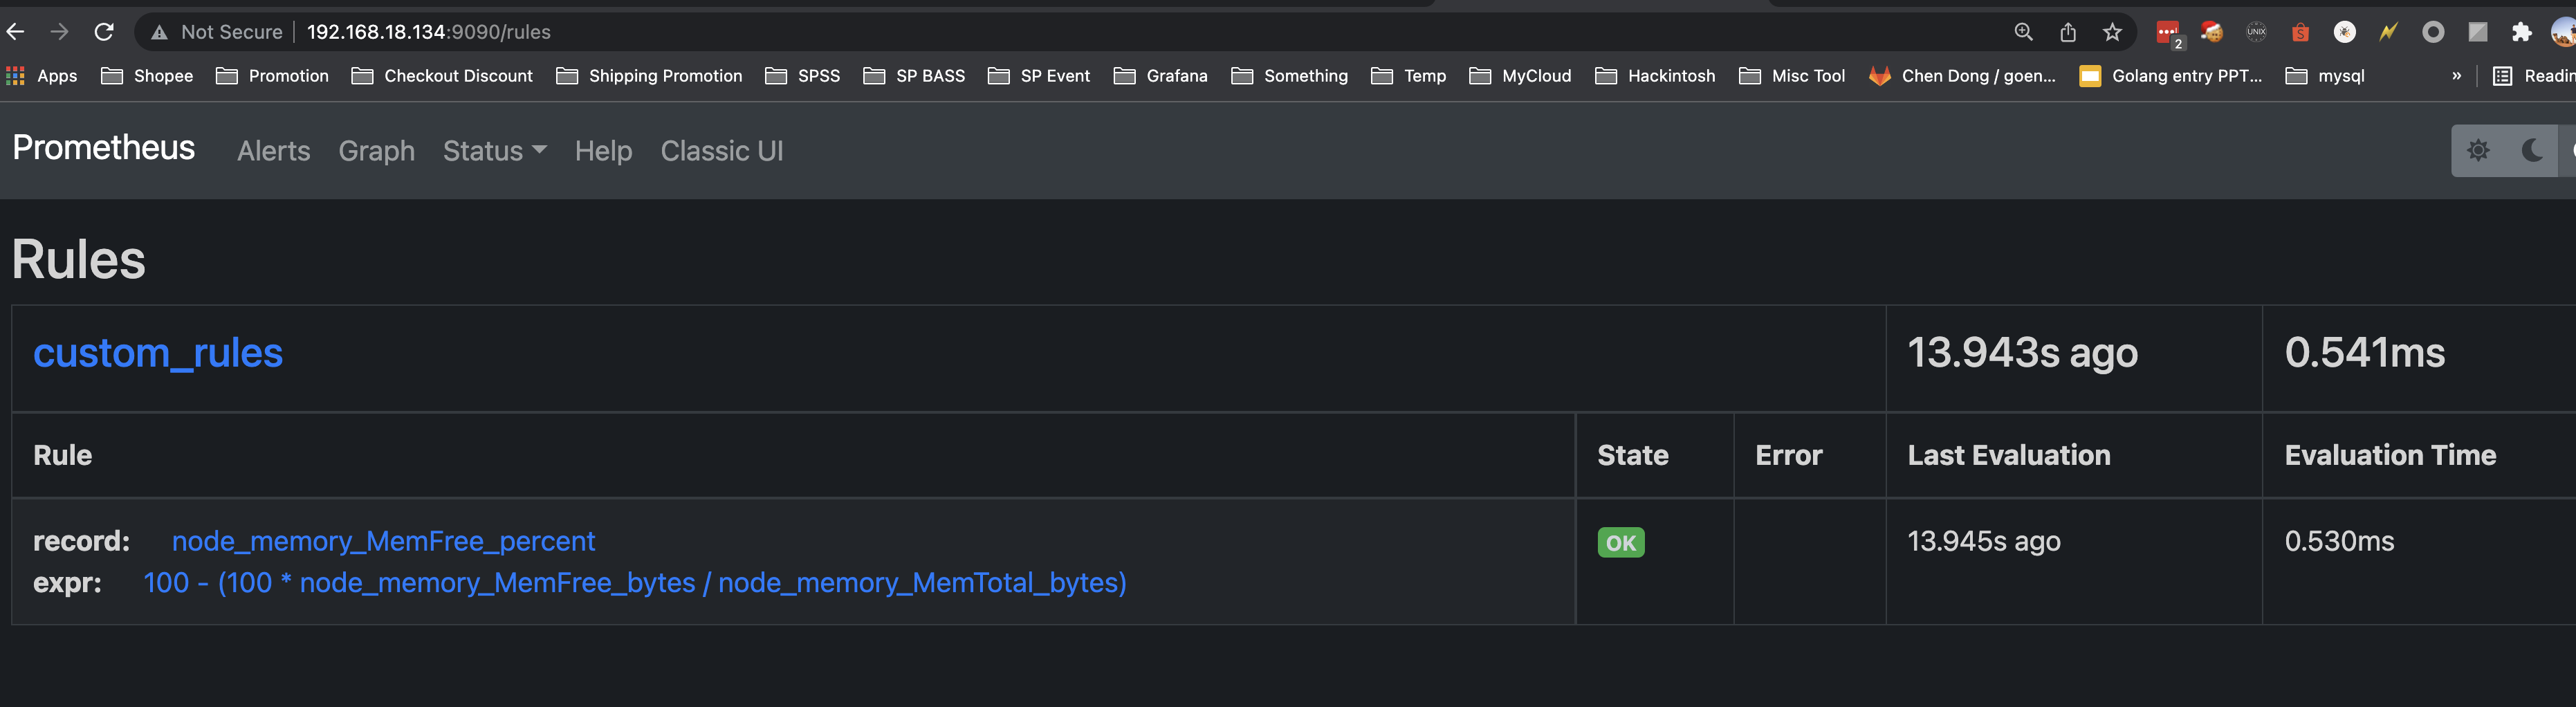
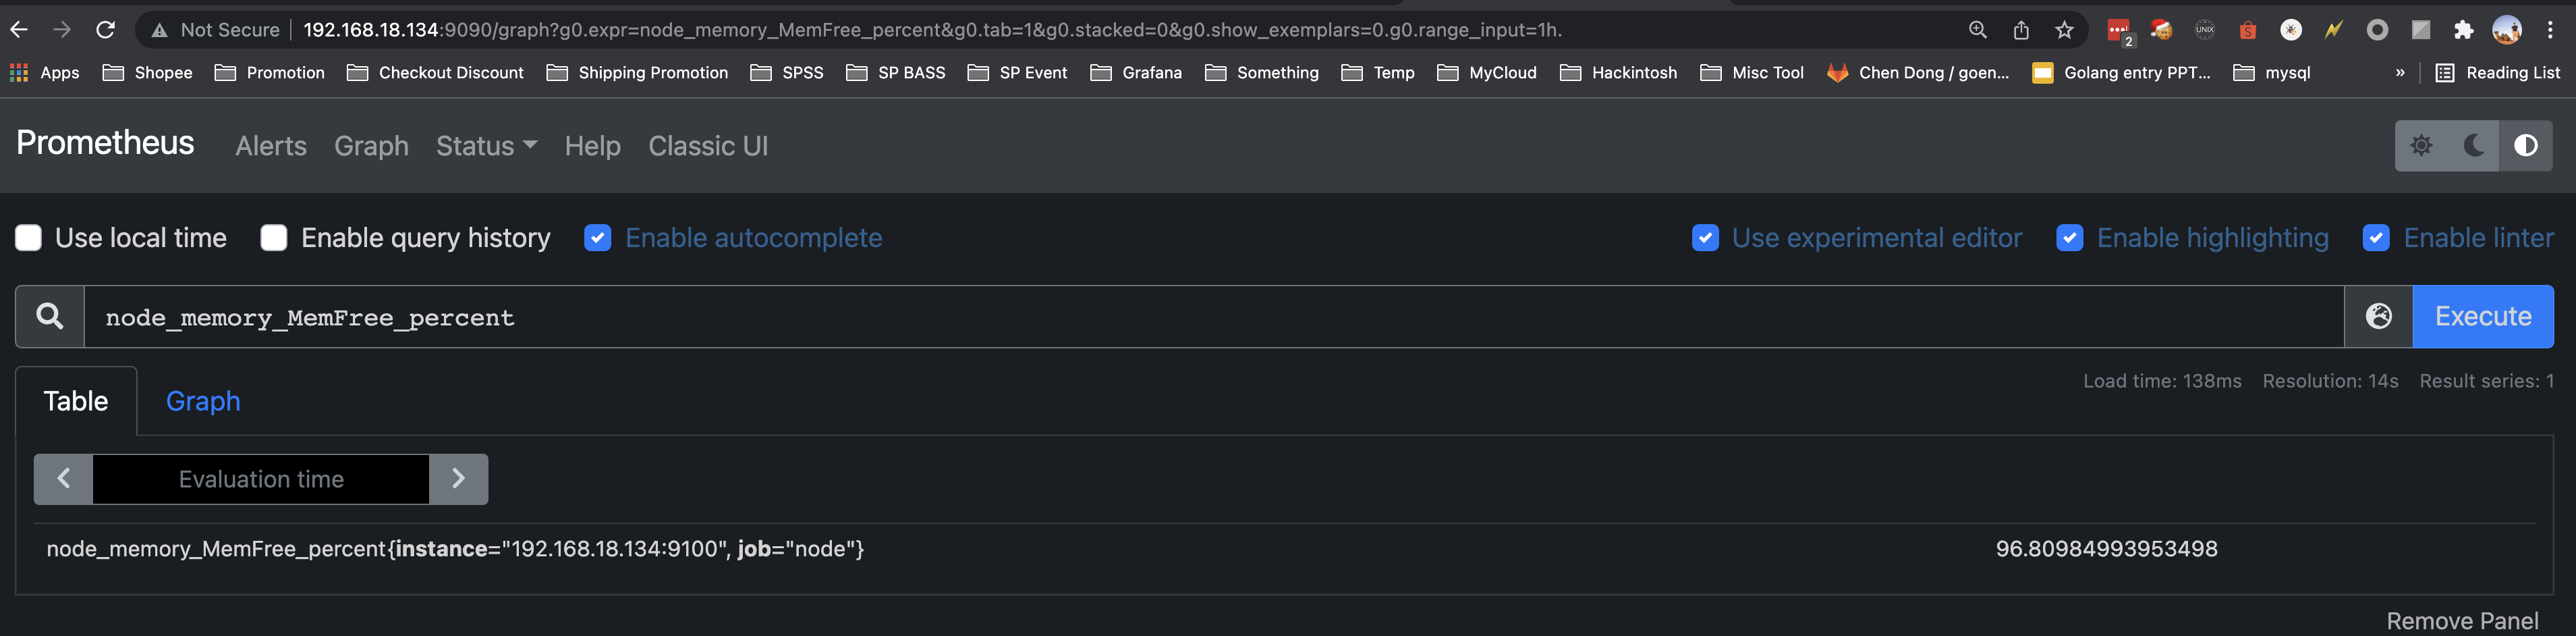
We can see the rules that we added in dashboard under Status [➡️](https://emojipedia.org/right-arrow/#:~:text=Emoji Meaning,An arrow%2C pointing right.&text=Right Arrow was approved as,to Emoji 1.0 in 2015.) Rules.
Best Practices
Recording rules should be of the general form level:metric:operations. level represents the aggregation level and labels of the rule output. metric is the metric name and should be unchanged other than stripping _total off counters when using rate() or irate(). operations is a list of operations that were applied to the metric, newest operation first.
Keeping the metric name unchanged makes it easy to know what a metric is and easy to find in the codebase.
To keep the operations clean, _sum is omitted if there are other operations, as sum(). Associative operations can be merged (for example min_min is the same as min).
If there is no obvious operation to use, use sum. When taking a ratio by doing division, separate the metrics using _per_ and call the operation ratio.
When aggregating up ratios, aggregate up the numerator and denominator separately and then divide. Do not take the average of a ratio or average of an average as that is not statistically valid.
When aggregating up the _count and _sum of a Summary and dividing to calculate average observation size, treating it as a ratio would be unwieldy. Instead keep the metric name without the _count or _sum suffix and replace the rate in the operation with mean. This represents the average observation size over that time period.
Always specify a without clause with the labels you are aggregating away. This is to preserve all the other labels such as job, which will avoid conflicts and give you more useful metrics and alerts.
Examples
Note the indentation style with outdented operators on their own line between two vectors. To make this style possible in Yaml, block quotes with an indentation indicator (e.g. |2) are used.
Aggregating up requests per second that has a path label:
- record: instance_path:requests:rate5m
  expr: rate(requests_total{job="myjob"}[5m])

- record: path:requests:rate5m
  expr: sum without (instance)(instance_path:requests:rate5m{job="myjob"})
Calculating a request failure ratio and aggregating up to the job-level failure ratio:
- record: instance_path:request_failures:rate5m
  expr: rate(request_failures_total{job="myjob"}[5m])

- record: instance_path:request_failures_per_requests:ratio_rate5m
  expr: |2
      instance_path:request_failures:rate5m{job="myjob"}
    /
      instance_path:requests:rate5m{job="myjob"}

# Aggregate up numerator and denominator, then divide to get path-level ratio.
- record: path:request_failures_per_requests:ratio_rate5m
  expr: |2
      sum without (instance)(instance_path:request_failures:rate5m{job="myjob"})
    /
      sum without (instance)(instance_path:requests:rate5m{job="myjob"})

# No labels left from instrumentation or distinguishing instances,
# so we use 'job' as the level.
- record: job:request_failures_per_requests:ratio_rate5m
  expr: |2
      sum without (instance, path)(instance_path:request_failures:rate5m{job="myjob"})
    /
      sum without (instance, path)(instance_path:requests:rate5m{job="myjob"})
Calculating average latency over a time period from a Summary:
- record: instance_path:request_latency_seconds_count:rate5m
  expr: rate(request_latency_seconds_count{job="myjob"}[5m])

- record: instance_path:request_latency_seconds_sum:rate5m
  expr: rate(request_latency_seconds_sum{job="myjob"}[5m])

- record: instance_path:request_latency_seconds:mean5m
  expr: |2
      instance_path:request_latency_seconds_sum:rate5m{job="myjob"}
    /
      instance_path:request_latency_seconds_count:rate5m{job="myjob"}

# Aggregate up numerator and denominator, then divide.
- record: path:request_latency_seconds:mean5m
  expr: |2
      sum without (instance)(instance_path:request_latency_seconds_sum:rate5m{job="myjob"})
    /
      sum without (instance)(instance_path:request_latency_seconds_count:rate5m{job="myjob"})
Calculating the average query rate across instances and paths is done using the avg() function:
- record: job:request_latency_seconds_count:avg_rate5m
  expr: avg without (instance, path)(instance:request_latency_seconds_count:rate5m{job="myjob"})
Notice that when aggregating that the labels in the without clause are removed from the level of the output metric name compared to the input metric names. When there is no aggregation, the levels always match. If this is not the case a mistake has likely been made in the rules.
Node
groups:
  # CPU
  - name: aggr_node_cpu_total
    rules:
      - record: job:node_cpu_busy_percent:total
        expr: sum(rate(node_cpu_seconds_total{job="node", mode!="idle"}[30s])) by (instance) > 0
  - name: aggr_node_cpu_by_cpu
    rules:
      - record: job:node_cpu_busy_percent:by_cpu
        expr: sum(rate(node_cpu_seconds_total{job="node", mode!="idle"}[30s])) by (instance, cpu) > 0

  # MEM
  - name: aggr_node_mem
    rules:
      - record: job:node_mem_usage_percent:total
        expr: 1 - ((node_memory_MemAvailable_bytes{job="node"}) / node_memory_MemTotal_bytes{job="node"})  > 0

  # NETWORK
  - name: aggr_node_net
    rules:
      - record: job:node_network_receive_rate_bytes:total
        expr: sum(rate(node_network_receive_bytes_total{device=~"(bond0\\..*|bond1\\..*|eth.*)", job="node"}[30s])) by (instance) > 0
      - record: job:node_network_transmit_rate_bytes:total
        expr: sum(rate(node_network_transmit_bytes_total{device=~"(bond0\\..*|bond1\\..*|eth.*)", job="node"}[30s])) by (instance) > 0

  # DISK
  - name: aggr_node_fs
    rules:
      - record: job:node_filesystem_usage_percent:by_mountpoint
        expr: (1 - sum(node_filesystem_avail_bytes{job=~"node", mountpoint=~"/tmp|/|/data.*|/boot"}) by (instance, mountpoint) / sum(node_filesystem_size_bytes{job=~"node", mountpoint=~"/tmp|/|/data.*|/boot"}) by (instance, mountpoint)) > 0
Container
groups:
- name: aggr_container
  rules:
  # CPU
  - record: job:container_cpu_busy_percent:total
    expr: sum(rate(container_cpu_usage_seconds_total{image!=""}[30s])) by (instance, container_label_MESOS_TASK_ID) > 0
  - record: job:container_cpu_quota:total
    expr: sum(container_spec_cpu_quota{image!=""}) by (instance, container_label_MESOS_TASK_ID) / 100000 > 0
  # MEM
  - record: job:container_mem_usage_bytes:total
    expr: sum(container_memory_rss{image!=""}) by (instance, container_label_MESOS_TASK_ID) > 0
  - record: job:container_mem_uage_percentage:total
    expr: sum(container_memory_rss{image!=""}) by (instance, container_label_MESOS_TASK_ID) / sum(container_spec_memory_limit_bytes{image!=""}) by (instance, container_label_MESOS_TASK_ID) > 0
  # NETWORK
  - record: job:container_network_receive_rate_bytes:total
    expr: sum(rate(container_network_receive_bytes_total{image!="", interface=~"bond[0-1]\\..*|eth.*"}[1m])) by (instance, container_label_MESOS_TASK_ID) > 0
  - record: job:container_network_transmit_rate_bytes:total
    expr: sum(rate(container_network_transmit_bytes_total{image!="", interface=~"bond[0-1]\\..*|eth.*"}[1m])) by (instance, container_label_MESOS_TASK_ID) > 0
  # DISK I/O
  - record: job:container_fs_writes_rate_bytes:total
    expr: sum(rate(container_fs_writes_bytes_total{image!=""}[1m])) by (instance, container_label_MESOS_TASK_ID) > 0
  - record: job:container_fs_reads_rate_bytes:total
    expr: sum(rate(container_fs_reads_bytes_total{image!=""}[1m])) by (instance, container_label_MESOS_TASK_ID) > 0
  - record: job:container_fs_writes_rate:total
    expr: sum(rate(container_fs_writes_total{image!=""}[1m])) by (instance, container_label_MESOS_TASK_ID) > 0
  - record: job:container_fs_reads_rate:total
    expr: sum(rate(container_fs_reads_total{image!=""}[1m])) by (instance, container_label_MESOS_TASK_ID) > 0
HTTP
groups:
- name: aggr_http_nginx
  rules:
  # Nginx
  - record: job:nginx_requests_total:error_rate
    expr: sum(irate(nginx_requests_total[2m])) by (host, status_code) > 0

  - record: job:nginx_requests_total:increase_by_endpoint
    expr: sum(increase(nginx_requests_total[1m])) by (host, status_code, endpoint) > 0
  - record: job:nginx_requests_total:increase_by_instance
    expr: sum(increase(nginx_requests_total[1m])) by (host, status_code, instance) > 0

  - record: job:service_requests_total:increase_by_endpoint
    expr: sum(increase(service_requests_total[1m])) by (service, status_code, endpoint) > 0
  - record: job:service_requests_total:increase_by_instance
    expr: sum(increase(service_requests_total[1m])) by (service, status_code, instance) > 0

  - record: job:nginx_request_latency_seconds:avg_by_endpoint
    expr: sum(increase(nginx_request_latency_seconds_sum[1m])) by (host, endpoint) / (sum(increase(nginx_request_latency_seconds_count[1m])) by (host, endpoint) > 0) > 0
  - record: job:nginx_request_latency_seconds:avg_by_instance
    expr: sum(increase(nginx_request_latency_seconds_sum[1m])) by (host, instance) / (sum(increase(nginx_request_latency_seconds_count[1m])) by (host, instance) > 0) > 0

  - record: job:nginx_request_size_bytes:avg_by_endpoint
    expr: sum(increase(nginx_request_size_bytes_sum[1m])) by (host, endpoint) / (sum(increase(nginx_request_size_bytes_count[1m])) by (host, endpoint) > 0) > 0
  - record: job:nginx_request_size_bytes:avg_by_instance
    expr: sum(increase(nginx_request_size_bytes_sum[1m])) by (host, instance) / (sum(increase(nginx_request_size_bytes_count[1m])) by (host, instance) > 0) > 0

  - record: job:nginx_response_size_bytes:avg_by_endpoint
    expr: sum(increase(nginx_response_size_bytes_sum[1m])) by (host, endpoint) / (sum(increase(nginx_response_size_bytes_count[1m])) by (host, endpoint) > 0) > 0
  - record: job:nginx_response_size_bytes:avg_by_instance
    expr: sum(increase(nginx_response_size_bytes_sum[1m])) by (host, instance) / (sum(increase(nginx_response_size_bytes_count[1m])) by (host, instance) > 0) > 0

- name: aggr_http_http_requests_total
  rules:
  # HTTP
  - record: job:requests_total:increase_by_endpoint
    expr: sum(increase(requests_total[1m])) by (job, status_code, endpoint) > 0
  - record: job:requests_total:increase_by_instance
    expr: sum(increase(requests_total[1m])) by (job, status_code, instance) > 0

- name: aggr_http_http_request_latency
  rules:
  - record: job:request_latency_seconds:avg_by_endpoint
    expr: sum(increase(request_latency_seconds_sum[1m])) by (job, endpoint) / (sum(increase(request_latency_seconds_count[1m])) by (job, endpoint) > 0) > 0
  - record: job:request_latency_seconds:avg_by_instance
    expr: sum(increase(request_latency_seconds_sum[1m])) by (job, instance) / (sum(increase(request_latency_seconds_count[1m])) by (job, instance) > 0) > 0

- name: aggr_http_http_request_size
  rules:
  - record: job:request_size_bytes:avg_by_endpoint
    expr: sum(increase(request_size_bytes_sum[1m])) by (job, endpoint) / (sum(increase(request_size_bytes_count[1m])) by (job, endpoint) > 0) > 0
  - record: job:request_size_bytes:avg_by_instance
    expr: sum(increase(request_size_bytes_sum[1m])) by (job, instance) / (sum(increase(request_size_bytes_count[1m])) by (job, instance) > 0) > 0

- name: aggr_http_http_response_size
  rules:
  - record: job:response_size_bytes:avg_by_endpoint
    expr: sum(increase(response_size_bytes_sum[1m])) by (job, endpoint) / (sum(increase(response_size_bytes_count[1m])) by (job, endpoint) > 0) > 0
  - record: job:response_size_bytes:avg_by_instance
    expr: sum(increase(response_size_bytes_sum[1m])) by (job, instance) / (sum(increase(response_size_bytes_count[1m])) by (job, instance) > 0) > 0

- name: aggr_http_http_available_greenlets
  rules:
  - record: job:available_greenlets_total:sum
    expr: sum(available_greenlets) by (instance, job)
Reference
- https://prometheus.io/docs/prometheus/latest/configuration/recording_rules/
- https://medium.com/javarevisited/create-recording-rules-in-prometheus-8a6a1c0b9e11
- https://www.youtube.com/watch?v=Xxo_gNRd5T4