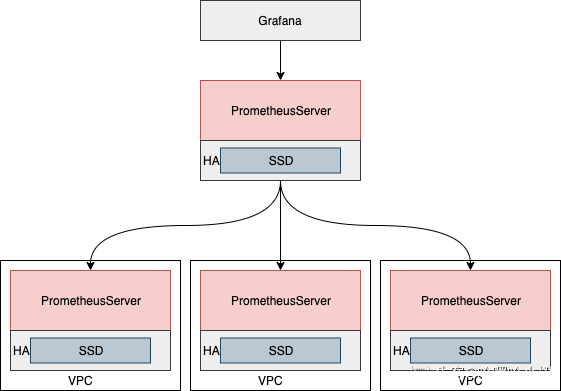
西维蜀黍

【Design Pattern】Microservices - Sidecar Pattern

Sidecar Pattern

Deploy components of an application into a separate process or container to provide isolation and encapsulation. This pattern can also enable applications to be composed of heterogeneous components and technologies.

This pattern is named Sidecar because it resembles a sidecar attached to a motorcycle. In the pattern, the sidecar is attached to a parent application and provides supporting features for the application. The sidecar also shares the same lifecycle as the parent application, being created and retired alongside the parent. The sidecar pattern is sometimes referred to as the sidekick pattern and is a decomposition pattern.

  ...


【Design Pattern】Behavioural - Command

Components

Four terms always associated with the command pattern are command, receiver, invoker and client.

A command object knows about receiver and invokes a method of the receiver. Values for parameters of the receiver method are stored in the command.

The receiver then does the work when the execute() method in command is called.

An invoker object knows how to execute a command, and optionally does bookkeeping about the command execution.

The invoker does not know anything about a concrete command, it knows only about the command interface.

Invoker object(s), command objects and receiver objects are held by a client object, the client decides which receiver objects it assigns to the command objects, and which commands it assigns to the invoker. The client decides which commands to execute at which points. To execute a command, it passes the command object to the invoker object.

  ...


【Prometheus】分布式 Prometheus

联邦集群+HA

通常Prometheus高可用部署方案为联邦集群+HA的方式部署,如图所示:

在联邦+HA部署中,在每个数据中心或者VPC内以HA的方式进行Prometheus Server部署,采集当前所在数据中心或VPC内的监控目标数据,然后由一个全局的Prometheus Server负责聚合多个数据中心或VPC的监控数据,提供统一接口给用户查询,这样的部署架构看似满足高可用,但也存在诸多问题。

  1. HA双副本或者更多副本运行的Prometheus Server收集的数据如何去重?
  2. 副本故障或副滚动升级造成数据出现断点,如何将多个副本数据进行互补,保证监控数据完整性?
  3. 中心Prometheus Server既要收集全局监控数据,又要提供给用户查询。
  4. 如何把控中心Server的负载 ? b.如何将监控数据高性能的方式提供给企业内部其它团队进行查询和汇聚?
  5. 各数据中心监控数据如何长期存放?那么如何部署Prometheus,能够解决如上问题呢?
  ...


【Prometheus】Best Practice

Cardinality

Prometheus performance almost always comes down to one thing: label cardinality.

Cardinality is how many unique values of something there are. So for example a label containing HTTP methods would have a cardinality of 2 if you had only GET and POST in your application.

It’s fairly common that things start out reasonable. You might have a histogram covering 2 HTTP methods, 7 HTTP paths, 5 machines, and a Prometheus typically only monitors one environment and datacenter. So that’s 2x7x5x12 = 840. Well within the capabilities of a single Prometheus.

What tends to catch you out is that things usually don’t grow in only one dimension. Increased traffic means more machines, and more users usually means more features so new endpoints. So you might now have say 3x8x6x12, which is an increase of just 1 for each of the first three factors, resulting in 1728 or more than double the original!

It’s still small overall, but this is just one metric, from one subsystem, and this is only one minor growth spurt. Over time growth accumulates and compounds, and can bring you to a point where gradually your Prometheus starts to creak. No one change caused it, but it still needs to be dealt with before your monitoring falls over. A Prometheus 2.x can handle somewhere north of ten millions series over a time window, which is rather generous, but unwise label choices can eat that surprisingly quickly.

Scrape Interval

  ...


【Prometheus】PromQL (Prometheus Query Language)

PromQL (Prometheus Query Language)

Prometheus通过指标名称(metrics name)以及对应的一组标签(labelset)唯一定义一条时间序列。指标名称反映了监控样本的基本标识,而label则在这个基本特征上为采集到的数据提供了多种特征维度。用户可以基于这些特征维度过滤,聚合,统计从而产生新的计算后的一条时间序列。

PromQL是Prometheus内置的数据查询语言,其提供对时间序列数据丰富的查询,聚合以及逻辑运算能力的支持。并且被广泛应用在Prometheus的日常应用当中,包括对数据查询、可视化、告警处理当中。可以这么说,PromQL是Prometheus所有应用场景的基础,理解和掌握PromQL是Prometheus入门的第一课。

  ...