PromQL (Prometheus Query Language)
Prometheus通过指标名称(metrics name)以及对应的一组标签(labelset)唯一定义一条时间序列。指标名称反映了监控样本的基本标识,而label则在这个基本特征上为采集到的数据提供了多种特征维度。用户可以基于这些特征维度过滤,聚合,统计从而产生新的计算后的一条时间序列。
PromQL是Prometheus内置的数据查询语言,其提供对时间序列数据丰富的查询,聚合以及逻辑运算能力的支持。并且被广泛应用在Prometheus的日常应用当中,包括对数据查询、可视化、告警处理当中。可以这么说,PromQL是Prometheus所有应用场景的基础,理解和掌握PromQL是Prometheus入门的第一课。
查询时间序列
当Prometheus通过Exporter采集到相应的监控指标样本数据后,我们就可以通过PromQL对监控样本数据进行查询。
当我们直接使用监控指标名称查询时,可以查询该指标下的所有时间序列。如:
http_requests_total
等同于:
http_requests_total{}
该表达式会返回指标名称为http_requests_total的所有时间序列:
http_requests_total{code="200",handler="alerts",instance="localhost:9090",job="prometheus",method="get"}=(20889@1518096812.326)
http_requests_total{code="200",handler="graph",instance="localhost:9090",job="prometheus",method="get"}=(21287@1518096812.326)
PromQL还支持用户根据时间序列的标签匹配模式来对时间序列进行过滤,目前主要支持两种匹配模式:完全匹配和正则匹配。
完全匹配
PromQL支持使用=和!=两种完全匹配模式:
- 通过使用
label=value可以选择那些标签满足表达式定义的时间序列; - 反之使用
label!=value则可以根据标签匹配排除时间序列;
例如,如果我们只需要查询所有http_requests_total时间序列中满足标签instance为localhost:9090的时间序列,则可以使用如下表达式:
http_requests_total{instance="localhost:9090"}
反之使用instance!="localhost:9090"则可以排除这些时间序列:
http_requests_total{instance!="localhost:9090"}
正则匹配
除了使用完全匹配的方式对时间序列进行过滤以外,PromQL还可以支持使用正则表达式作为匹配条件,多个表达式之间使用|进行分离:
- 使用
label=~regx表示选择那些标签符合正则表达式定义的时间序列; - 反之使用
label!~regx进行排除;
Example
例如,如果想查询多个环节下的时间序列序列可以使用如下表达式:
http_requests_total{environment=~"staging|testing|development",method!="GET"}
Using regular expressions, you could select time series only for jobs whose name match a certain pattern, in this case, all jobs that end with server:
http_requests_total{job=~".*server"}
To select all HTTP status codes except 4xx ones, you could run:
http_requests_total{status!~"4.."}
# 表示查询 code 不为 "200" 的数据
http_requests_total{code!="200"}

# 表示查询 code 为 "2xx" 的数据
http_requests_total{code=~"2.."}

# 表示查询 code 以 "2" 开头的数据(后面包含 0 到多个任意字符)
http_requests_total{code=~"2.*"}

# 查询 endpoint 以 ".api/^" 开头的数据
# 对特殊字符需要使用 “\\” 进行转义
http_requests_total{endpoint=~".api/\\^"}

# API 平均 latency
avg(job:request_latency_seconds:avg_by_endpoint{job=~"promotion", datacenter=~"sg", endpoint=~".api/promotion/\^logistics/."}) by (endpoint)
空字符串的匹配
注意,所有的 PromQL 表达式必须至少包含一个指标名称,或者一个不会匹配到空字符串的标签过滤器。
以下表达式是非法的(因为会匹配到空字符串):
{job=~".*"} # 非法!
以下表达式是合法的:
http_request_total # 合法
http_request_total{} # 合法
{method="get"} # 合法
{job=~".+"}              # 合法!
{job=~".*",method="get"} # 合法!
除了使用 <metric name>{label=value} 的形式以外,我们还可以使用内置的 __name__ 标签来指定监控指标名称。例如:表达式 http_requests_total 等效于 {__name__="http_requests_total"}。也可以使用除 = 之外的过滤器(=,=~,~)。以下表达式选择指标名称以 job: 开头的所有指标:
{__name__=~"job:.*"}
All regular expressions in Prometheus use RE2 syntax.
PromQL中的数据类型
在 Prometheus 的表达式语言中,表达式或子表达式包括以下四种类型之一:
- Time series Selectors
- 瞬时向量选择器(Instant vector selectors) - 一组时间序列,每个时间序列包含单个样本,它们共享相同的时间戳。也就是说,表达式的返回值中只会包含该时间序列中的最新的一个样本值。而相应的这样的表达式称之为瞬时向量表达式。
- 区间向量选择器(Range vector selectors) - 一组时间序列,每个时间序列包含一段时间范围内的样本数据。
- 字面量(Literals)
- 标量(Scalar) - 一个浮点型的数据值。
- 字符串(String) - 一个简单的字符串值。
根据用户输入的表达式返回的数据类型是否合法取决于用例的不同,例如:瞬时向量表达式返回的数据类型是唯一可以直接绘制成图表的数据类型。
字面量(Literals)
除了使用瞬时向量表达式和区间向量表达式以外,PromQL还直接支持用户使用标量(Scalar)和字符串(String)。
标量(Scalar)- 整型(integer)/浮点型(floating-point)数字
Scalar float values can be written as literal integer or floating-point numbers in the format (whitespace only included for better readability):
[-+]?(
      [0-9]*\.?[0-9]+([eE][-+]?[0-9]+)?
    | 0[xX][0-9a-fA-F]+
    | [nN][aA][nN]
    | [iI][nN][fF]
)
Examples:
23
-2.43
3.4e-9
0x8f
-Inf
NaN
需要注意的是,当使用表达式count(http_requests_total),返回的数据类型,依然是瞬时向量。用户可以通过内置函数scalar()将单个瞬时向量转换为标量。
字符串(String)
Strings may be specified as literals in single quotes, double quotes or backticks.
PromQL follows the same escaping rules as Go. In single or double quotes a backslash begins an escape sequence, which may be followed by a, b, f, n, r, t, v or \. Specific characters can be provided using octal (\nnn) or hexadecimal (\xnn, \unnnn and \Unnnnnnnn).
No escaping is processed inside backticks. Unlike Go, Prometheus does not discard newlines inside backticks.
Example:
"this is a string"
'these are unescaped: \n \\ \t'
`these are not unescaped: \n ' " \t`
Time series Selectors
瞬时向量选择器(Instant vector selectors)
Instant vector selectors allow the selection of a set of time series and a single sample value for each at a given timestamp (instant): in the simplest form, only a metric name is specified. This results in an instant vector containing elements for all time series that have this metric name.
This example selects all time series that have the http_requests_total metric name:
http_requests_total
It is possible to filter these time series further by appending a comma separated list of label matchers in curly braces ({}).
This example selects only those time series with the http_requests_total metric name that also have the job label set to prometheus and their group label set to canary:
http_requests_total{job="prometheus",group="canary"}
It is also possible to negatively match a label value, or to match label values against regular expressions. The following label matching operators exist:
=: Select labels that are exactly equal to the provided string.!=: Select labels that are not equal to the provided string.=~: Select labels that regex-match the provided string.!~: Select labels that do not regex-match the provided string.
For example, this selects all http_requests_total time series for staging, testing, and development environments and HTTP methods other than GET.
http_requests_total{environment=~"staging|testing|development",method!="GET"}
Label matchers that match empty label values also select all time series that do not have the specific label set at all. Regex-matches are fully anchored. It is possible to have multiple matchers for the same label name.
Vector selectors must either specify a name or at least one label matcher that does not match the empty string. The following expression is illegal:
{job=~".*"} # Bad!
In contrast, these expressions are valid as they both have a selector that does not match empty label values.
{job=~".+"}              # Good!
{job=~".*",method="get"} # Good!
Label matchers can also be applied to metric names by matching against the internal __name__ label. For example, the expression http_requests_total is equivalent to {__name__="http_requests_total"}. Matchers other than = (!=, =~, !~) may also be used. The following expression selects all metrics that have a name starting with job::
{__name__=~"job:.*"}
The metric name must not be one of the keywords bool, on, ignoring, group_left and group_right. The following expression is illegal:
on{} # Bad!
A workaround for this restriction is to use the __name__ label:
{__name__="on"} # Good!
All regular expressions in Prometheus use RE2 syntax.
区间向量选择器(Range vector selectors)
Example 1
区间向量表达式和瞬时向量表达式之间的差异在于在区间向量表达式中我们需要定义时间选择的范围,时间范围通过时间范围选择器[]进行定义。例如,通过以下表达式可以选择最近5分钟内的所有样本数据:
http_requests_total{}[5m]
该表达式将会返回查询到的时间序列中最近5分钟的所有样本数据:
http_requests_total{code="200",handler="alerts",instance="localhost:9090",job="prometheus",method="get"}=[
    1@1518096812.326
    1@1518096817.326
    1@1518096822.326
    1@1518096827.326
    1@1518096832.326
    1@1518096837.325
]
http_requests_total{code="200",handler="graph",instance="localhost:9090",job="prometheus",method="get"}=[
    4 @1518096812.326
    4@1518096817.326
    4@1518096822.326
    4@1518096827.326
    4@1518096832.326
    4@1518096837.325
]
PromQL的时间范围选择器支持的时间单位:
ms- millisecondss- secondsm- minutesh- hoursd- days - assuming a day has always 24hw- weeks - assuming a week has always 7dy- years - assuming a year has always 365d
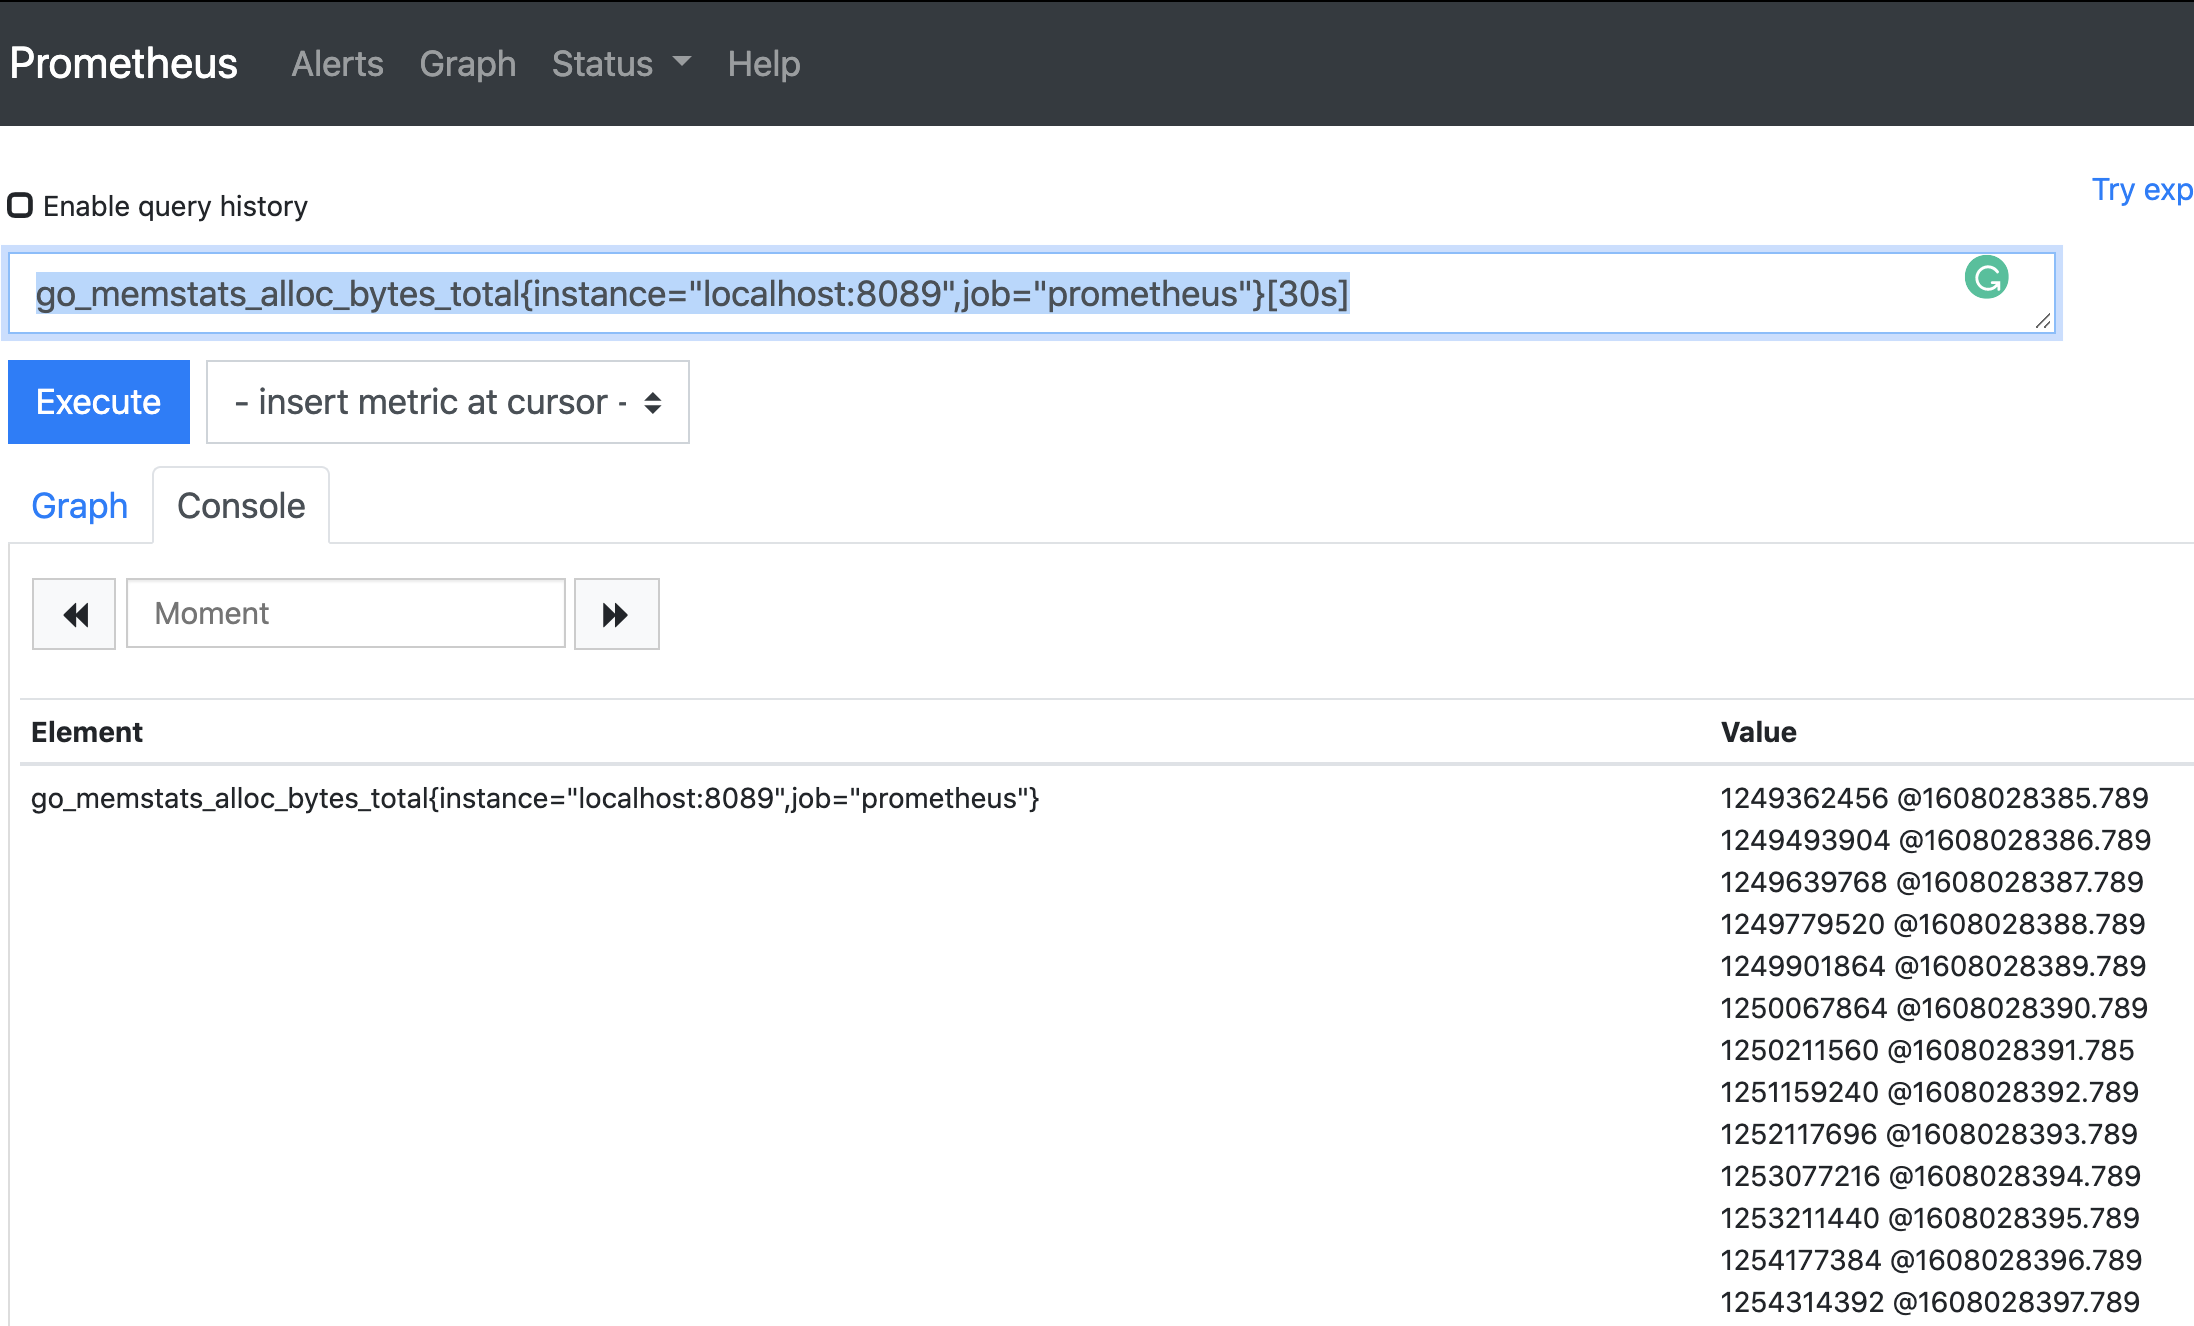
Example 2
go_memstats_alloc_bytes_total{instance="localhost:8089",job="prometheus"}[30s]
Time Durations
Time durations are specified as a number, followed immediately by one of the following units:
ms- millisecondss- secondsm- minutesh- hoursd- days - assuming a day has always 24hw- weeks - assuming a week has always 7dy- years - assuming a year has always 365d
Time durations can be combined, by concatenation. Units must be ordered from the longest to the shortest. A given unit must only appear once in a time duration.
Here are some examples of valid time durations:
5h
1h30m
5m
10s
时间位移操作
在瞬时向量表达式或者区间向量表达式中,都是以当前时间为基准:
http_request_total{} # 瞬时向量表达式,选择当前最新的数据
http_request_total{}[5m] # 区间向量表达式,选择以当前时间为基准,5分钟内的数据
而如果我们想查询,5分钟前的瞬时样本数据,或昨天一天的区间内的样本数据呢? 这个时候我们就可以使用位移操作,位移操作的关键字为offset。
可以使用offset时间位移操作:
http_request_total{} offset 5m
http_request_total{}[1d] offset 1d
Note that the offset modifier always needs to follow the selector immediately, i.e. the following would be correct:
sum(http_requests_total{method="GET"} offset 5m) // GOOD.
While the following would be incorrect:
sum(http_requests_total{method="GET"}) offset 5m // INVALID.
The same works for range vectors. This returns the 5-minute rate that http_requests_total had a week ago:
rate(http_requests_total[5m] offset 1w)
使用聚合操作
一般来说,如果描述样本特征的标签(label)在并非唯一的情况下,通过PromQL查询数据,会返回多条满足这些特征维度的时间序列。而PromQL提供的聚合操作可以用来对这些时间序列进行处理,形成一条新的时间序列:
# 查询系统所有http请求的总量
sum(http_request_total)

# 按照mode计算主机CPU的平均使用时间
avg(node_cpu_seconds_total) by (cpu)

# 按照主机查询各个主机的CPU使用率
sum(sum(irate(node_cpu{mode!='idle'}[5m]))  / sum(irate(node_cpu[5m]))) by (instance)
特殊字符
# 查询 endpoint 以 ".api/^" 开头的数据
// 改一下
# 对特殊字符需要使用 “\\” 进行转义
http_requests_total{endpoint=~".api/\\^"}
PromQL 遵循与 Go 相同的转义规则。在单引号或双引号中,用反斜杠来表示转义序列,后面可以跟 a, b, f, n, r, t, v 或 \。特殊字符可以使用八进制(\nnn)或者十六进制(\xnn,\unnnn 和 \Unnnnnnnn)。
The following special escape values are also available.
| Value | Description |
|---|---|
\a |
Alert or bell |
\b |
Backspace |
\\ |
Backslash |
\t |
Horizontal tab |
\n |
Line feed or newline |
\f |
Form feed |
\r |
Carriage return |
\v |
Vertical tab |
\' |
Single quote (only in rune literals) |
\" |
Double quote (only in string literals) |
与 Go 不同,Prometheus 不会对反引号内的换行符进行转义。
例如:
"this is a string"
'these are unescaped: \n \\ \t'
`these are not unescaped: \n ' " \t`
操作符
Queries
Subquery
Return the 5-minute rate of the http_requests_total metric for the past 30 minutes, with a resolution of 1 minute.
rate(http_requests_total[5m])[30m:1m]
This is an example of a nested subquery. The subquery for the deriv function uses the default resolution. Note that using subqueries unnecessarily is unwise.
max_over_time(deriv(rate(distance_covered_total[5s])[30s:5s])[10m:])
Using functions, operators, etc.
Return the per-second rate for all time series with the http_requests_total metric name, as measured over the last 5 minutes:
rate(http_requests_total[5m])
Assuming that the http_requests_total time series all have the labels job (fanout by job name) and instance (fanout by instance of the job), we might want to sum over the rate of all instances, so we get fewer output time series, but still preserve the job dimension:
sum by (job) (
  rate(http_requests_total[5m])
)
If we have two different metrics with the same dimensional labels, we can apply binary operators to them and elements on both sides with the same label set will get matched and propagated to the output. For example, this expression returns the unused memory in MiB for every instance (on a fictional cluster scheduler exposing these metrics about the instances it runs):
(instance_memory_limit_bytes - instance_memory_usage_bytes) / 1024 / 1024
The same expression, but summed by application, could be written like this:
sum by (app, proc) (
  instance_memory_limit_bytes - instance_memory_usage_bytes
) / 1024 / 1024
If the same fictional cluster scheduler exposed CPU usage metrics like the following for every instance:
instance_cpu_time_ns{app="lion", proc="web", rev="34d0f99", env="prod", job="cluster-manager"}
instance_cpu_time_ns{app="elephant", proc="worker", rev="34d0f99", env="prod", job="cluster-manager"}
instance_cpu_time_ns{app="turtle", proc="api", rev="4d3a513", env="prod", job="cluster-manager"}
instance_cpu_time_ns{app="fox", proc="widget", rev="4d3a513", env="prod", job="cluster-manager"}
...
…we could get the top 3 CPU users grouped by application (app) and process type (proc) like this:
topk(3, sum by (app, proc) (rate(instance_cpu_time_ns[5m])))
Assuming this metric contains one time series per running instance, you could count the number of running instances per application like this:
count by (app) (instance_cpu_time_ns)
Useful Metrics
Average request duration
To calculate the average request duration during the last 5 minutes from a histogram or summary called http_request_duration_seconds, use the following expression:
  rate(http_request_duration_seconds_sum[5m])
/
  rate(http_request_duration_seconds_count[5m])
Percentile
Using histograms, the aggregation is perfectly possible with the histogram_quantile() function.
histogram_quantile(0.95, sum(rate(http_request_duration_seconds_bucket[5m])) by (le)) // GOOD.
算QPS
sum(job:test_tcp_qps:irate1m{service_name=~"promotion.logistics"}) by (api)
CPU Usage 最大值
cmax(job:cache_proxy_instance_cpu_usage_percent:by_instance{container_label_cluster="server.promotion.test.live.sg"})c
Redis CPU Usage - 只看前十个
topk(10, job:cache_proxy_instance_cpu_usage_percent:by_instance{container_label_cluster="server.promotion.test.live.sg"})
Reference
- https://prometheus.io/docs/prometheus/latest/querying/basics/
- https://github.com/prometheus/prometheus
- https://prometheus.io/docs/prometheus/
- https://yunlzheng.gitbook.io/prometheus-book/parti-prometheus-ji-chu/promql/prometheus-query-language
- https://golang.org/ref/spec#String_literals
- https://yourbasic.org/golang/multiline-string/
- https://prometheus.fuckcloudnative.io/di-san-zhang-prometheus/di-4-jie-cha-xun/basics
- https://en.wikipedia.org/wiki/Time_series
- https://blog.csdn.net/palet/article/details/82763695
- https://prometheus.io/docs/prometheus/latest/querying/functions/
- https://www.metricfire.com/blog/understanding-the-prometheus-rate-function/
- https://medium.com/javarevisited/create-recording-rules-in-prometheus-8a6a1c0b9e11
- https://prometheus.io/docs/prometheus/latest/querying/operators/