排查 goroutine 泄露
由于 Golang 自带内存回收,所以一般不会发生内存泄露。但凡事都有例外,在 golang 中, goroutine 本身是可能泄露的,或者叫 goroutine 失控,进而导致内存泄露。
Demo
package main
import (
"net/http"
_ "net/http/pprof"
"time"
)
func main() {
stupidGoroutineUse()
http.ListenAndServe("0.0.0.0:6060", nil)
}
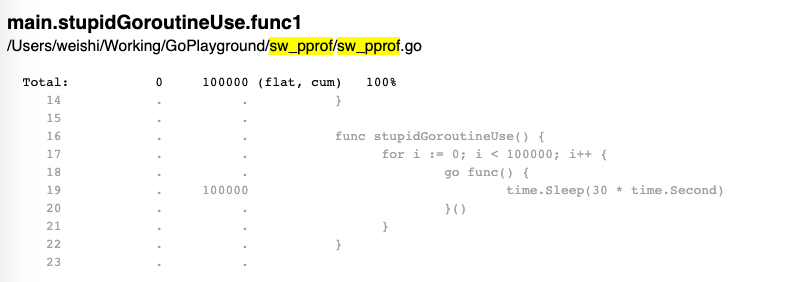
func stupidGoroutineUse() {
for i := 0; i < 100000; i++ {
go func() {
time.Sleep(30 * time.Second)
}()
}
}
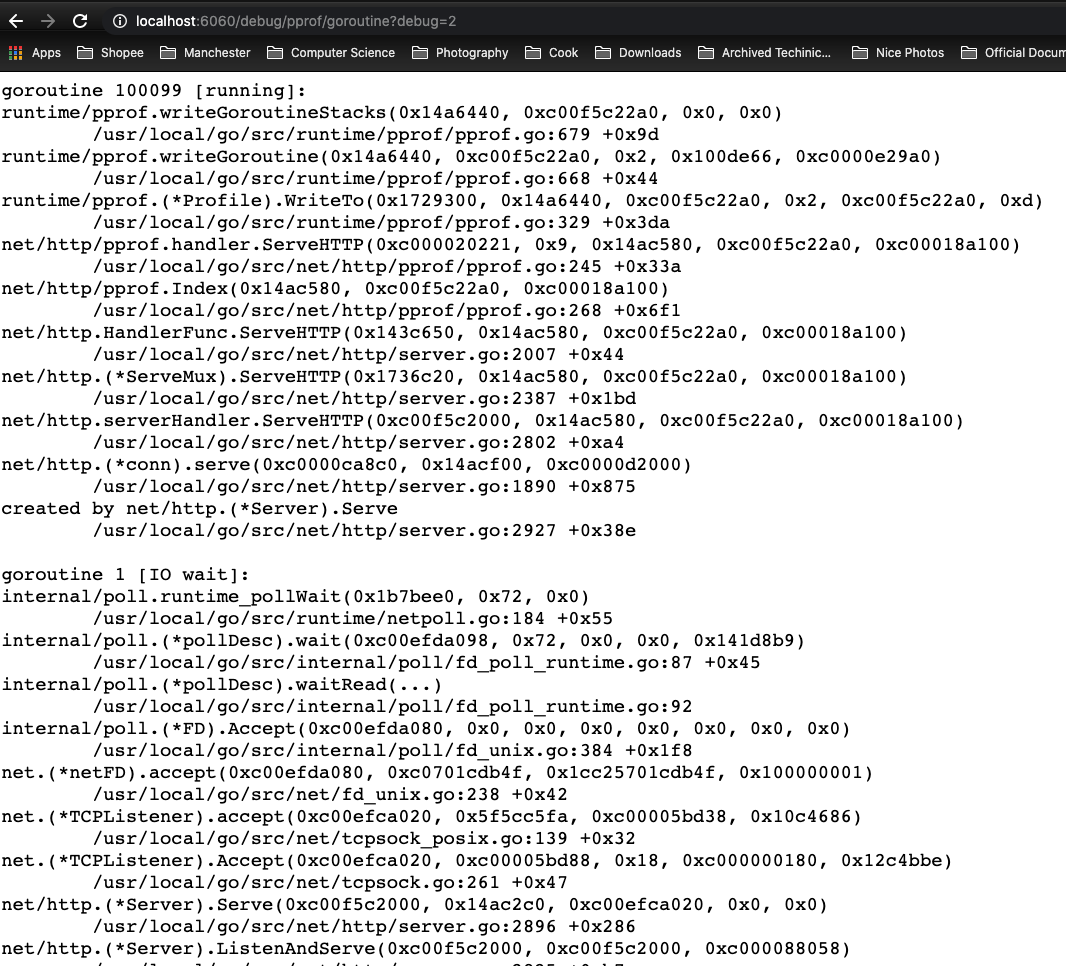
列举当前所有 goroutine :
- http://localhost:6060/debug/pprof/goroutine?debug=1 :将函数地址转换为函数名,即脱离 pprof 在浏览器中直接查看。
- http://localhost:6060/debug/pprof/goroutine?debug=2 :将以 unrecovered panic 的格式打印堆栈,可读性更高
$ go tool pprof -http localhost:9999 http://localhost:6060/debug/pprof/goroutine
Fetching profile over HTTP from http://localhost:6060/debug/pprof/goroutine
Saved profile in /Users/weishi/pprof/pprof.goroutine.008.pb.gz
Serving web UI on http://localhost:9999
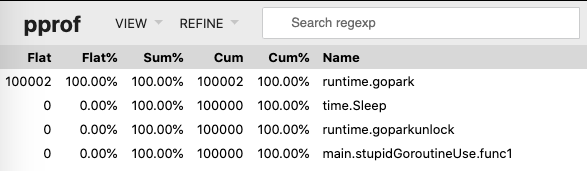
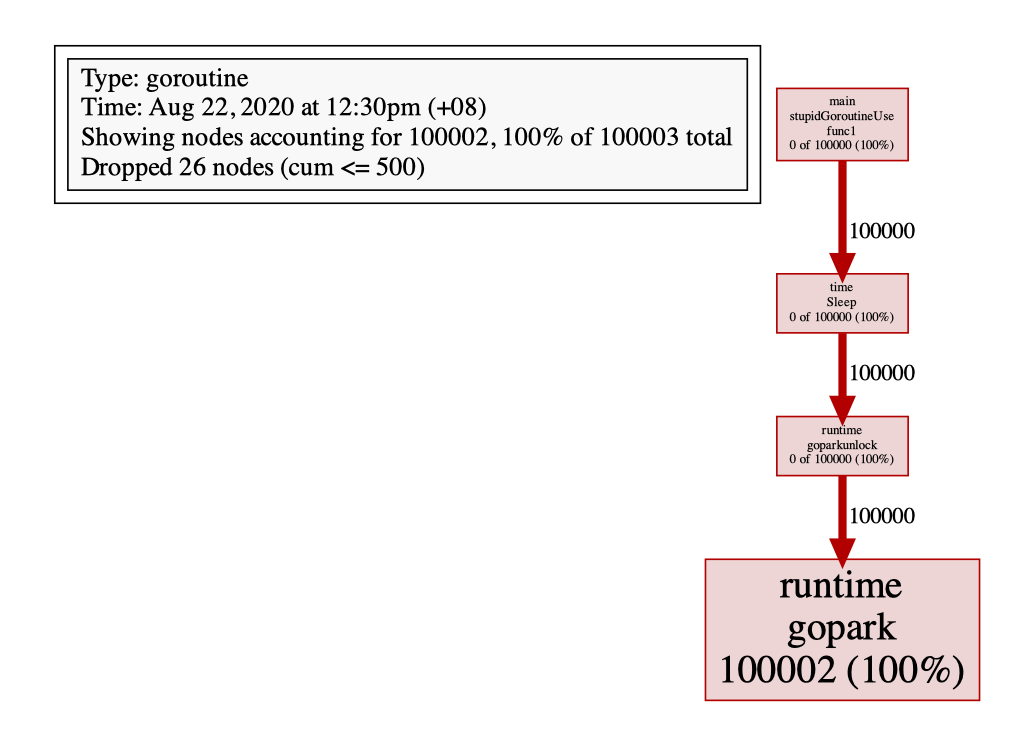
可以看到,stupidGoroutineUse 函数每次会创建 10000 个 goroutine ,每个 goroutine 会睡眠 30 秒后退出,而如果stupidGoroutineUse函数会被反复调用,这才导致大量 goroutine 泄露,试想一下,如果释放出的 goroutine 会永久阻塞,那么泄露的 goroutine 数便会持续增加,内存的占用也会持续增加。
注意,由于 goroutine 的创建是通过 runtime.gopark,因为我们需要查找与自己项目相关的 function name,并看其 Cum:
创建过多 goroutine
创建goroutine这个操作本身也是有代价的,因为如果需要大量创建goroutine,可能可以考虑使用goroutine pool,来避免大量的goroutine被创建。
同时可以使用trace.Start() 来观察当大量goroutine被创建时,在goroutine中用于执行代码的时间占它生命周期的总时间的比重,如果很小(如下图中情况),这意味着大部分时间都花在了等待被scheduler schedule上(蓝色部分):
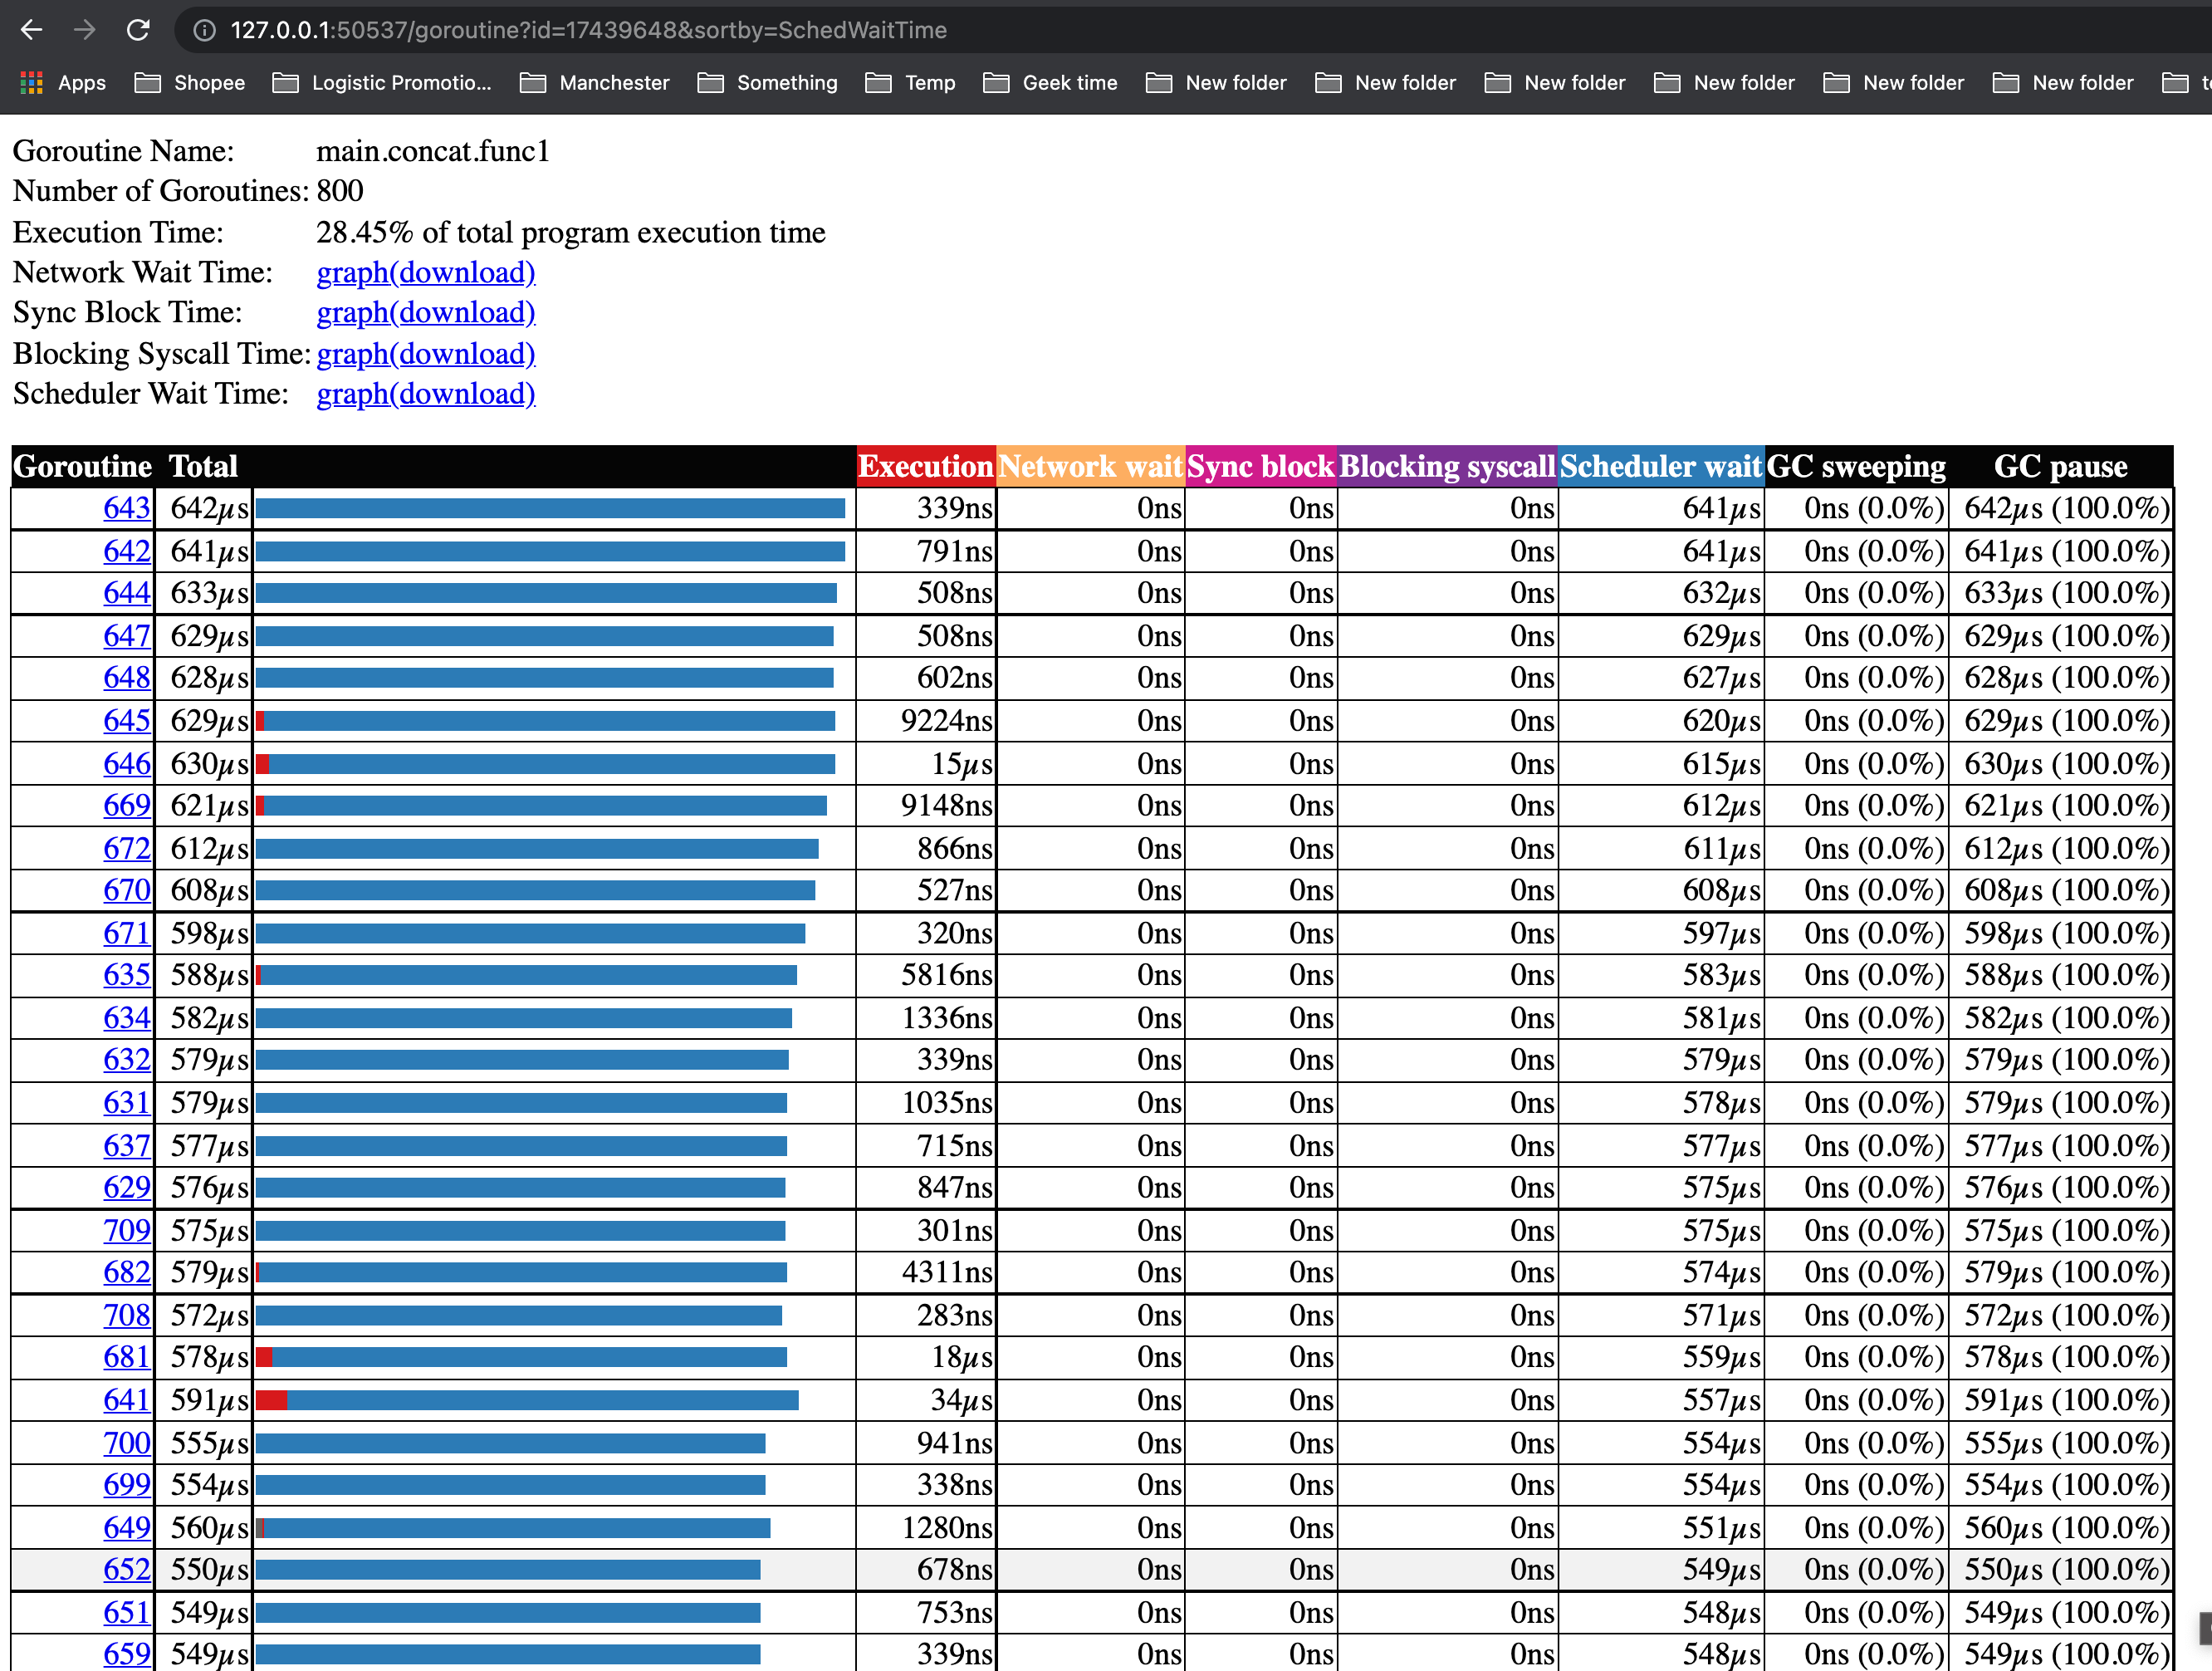
这时候就要考虑如果减少在等待 scheduler schedule的时间。
其实一个原因:goroutine本身会消耗内存,而长时间的等待被调度则意味着占用的内存长期不能被释放。
Reference
- https://github.com/google/pprof/blob/master/doc/README.md
- https://golang.org/doc/diagnostics.html
- https://golang.org/pkg/net/http/pprof/
- https://blog.golang.org/pprof
- https://golang.org/pkg/runtime/pprof/
- https://blog.wolfogre.com/posts/go-ppof-practice/
FEATURED TAGS
algorithm
algorithmproblem
architecturalpattern
architecture
aws
blockchain
c#
cachesystem
codis
compile
concurrentcontrol
database
dataformat
datastructure
debug
design
designpattern
distributedsystem
django
docker
domain
engineering
freebsd
git
golang
grafana
hackintosh
hadoop
hardware
hexo
http
hugo
ios
iot
java
javaee
javascript
kafka
kubernetes
linux
linuxcommand
linuxio
lock
macos
markdown
microservices
mysql
nas
network
networkprogramming
nginx
node.js
npm
oop
openwrt
operatingsystem
padavan
performance
programming
prometheus
protobuf
python
redis
router
security
shell
software testing
spring
sql
systemdesign
truenas
ubuntu
vmware
vpn
windows
wmware
wordpress
xml
zookeeper