安装
Ubuntu
$ sudo apt-get install -y apt-transport-https
$ sudo apt-get install -y software-properties-common wget
$ wget -q -O - https://packages.grafana.com/gpg.key | sudo apt-key add -
Add this repository for stable releases:
$ echo "deb https://packages.grafana.com/oss/deb stable main" | sudo tee -a /etc/apt/sources.list.d/grafana.list
After you add the repository:
$ sudo apt-get update
$ sudo apt-get install grafana
macOS
$ brew update
$ brew install grafana
启动
Linux
# 查看服务状态
$ sudo systemctl status grafana-server
# 启动服务
$ sudo systemctl start grafana-server
# 开机自启动
$ sudo systemctl enable grafana-server
macOS
# start
$ brew services start grafana
# stop
$ brew services stop grafana
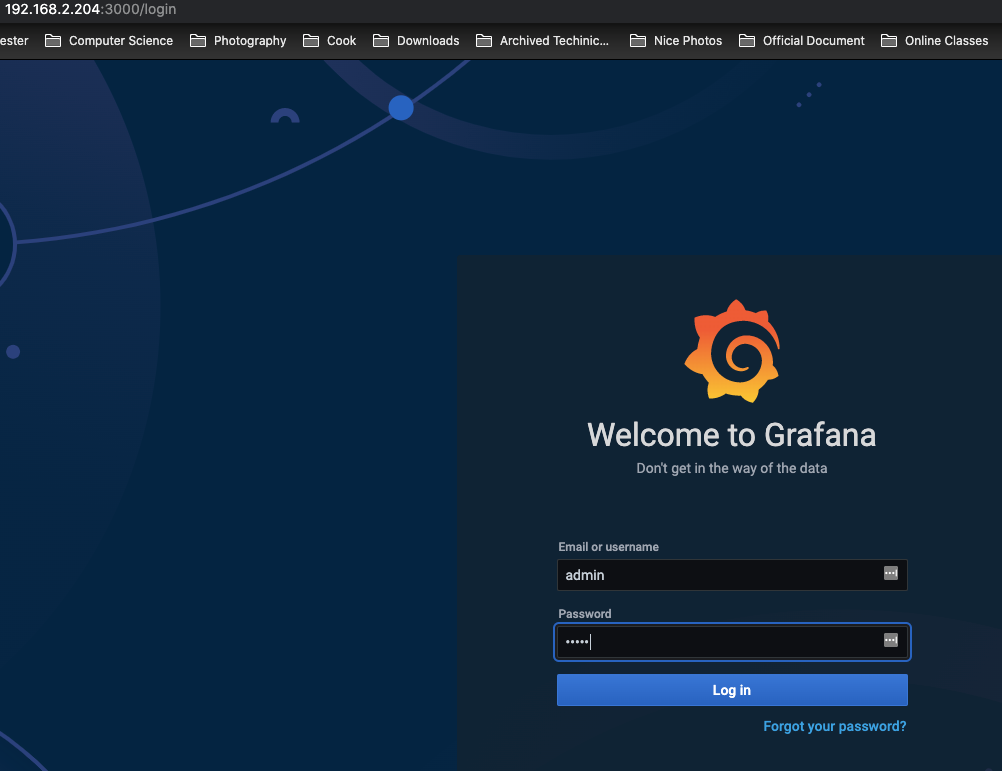
- http://192.168.2.204:3000/login
- 默认管理员账号和密码 admin admin
Docker
# 如果希望设置为在宿主机开机后,这个 grafana Docker instance 也一直运行
# 不能用sudo,如果用sudo,可能出现在当前用户下docker ps后看不到已经启动的instance
$ docker run -d \
--restart unless-stopped \
-p 3000:3000 \
--name grafana \
-v /etc/localtime:/etc/localtime:ro \
-v /etc/timezone:/etc/timezone \
grafana/grafana
默认管理员账号和密码都是 admin。
Debug
如果无法连接上Prometheus,则可以将 Grafana container和 Prometheus container加入到同一个 docker network,具体参考 https://swsmile.info/post/docker-container-network/ 。
Reference
FEATURED TAGS
algorithm
algorithmproblem
architecturalpattern
architecture
aws
blockchain
c#
cachesystem
codis
compile
concurrentcontrol
database
dataformat
datastructure
debug
design
designpattern
distributedsystem
django
docker
domain
engineering
freebsd
git
golang
grafana
hackintosh
hadoop
hardware
hexo
http
hugo
ios
iot
java
javaee
javascript
kafka
kubernetes
linux
linuxcommand
linuxio
lock
macos
markdown
microservices
mysql
nas
network
networkprogramming
nginx
node.js
npm
oop
openwrt
operatingsystem
padavan
performance
programming
prometheus
protobuf
python
redis
router
security
shell
software testing
spring
sql
systemdesign
truenas
ubuntu
vmware
vpn
windows
wmware
wordpress
xml
zookeeper