Prometheus
Prometheus, a Cloud Native Computing Foundation project, is a systems and service monitoring system. It collects metrics from configured targets at given intervals, evaluates rule expressions, displays the results, and can trigger alerts if some condition is observed to be true.
Prometheus’s main distinguishing features as compared to other monitoring systems are:
- a multi-dimensional data model (timeseries defined by metric name and set of key/value dimensions)
- a flexible query language to leverage this dimensionality
- no dependency on distributed storage; single server nodes are autonomous
- timeseries collection happens via a pull model over HTTP
- pushing timeseries is supported via an intermediary gateway
- targets are discovered via service discovery or static configuration
- multiple modes of graphing and dashboarding support
- support for hierarchical and horizontal federation
Architecture overview
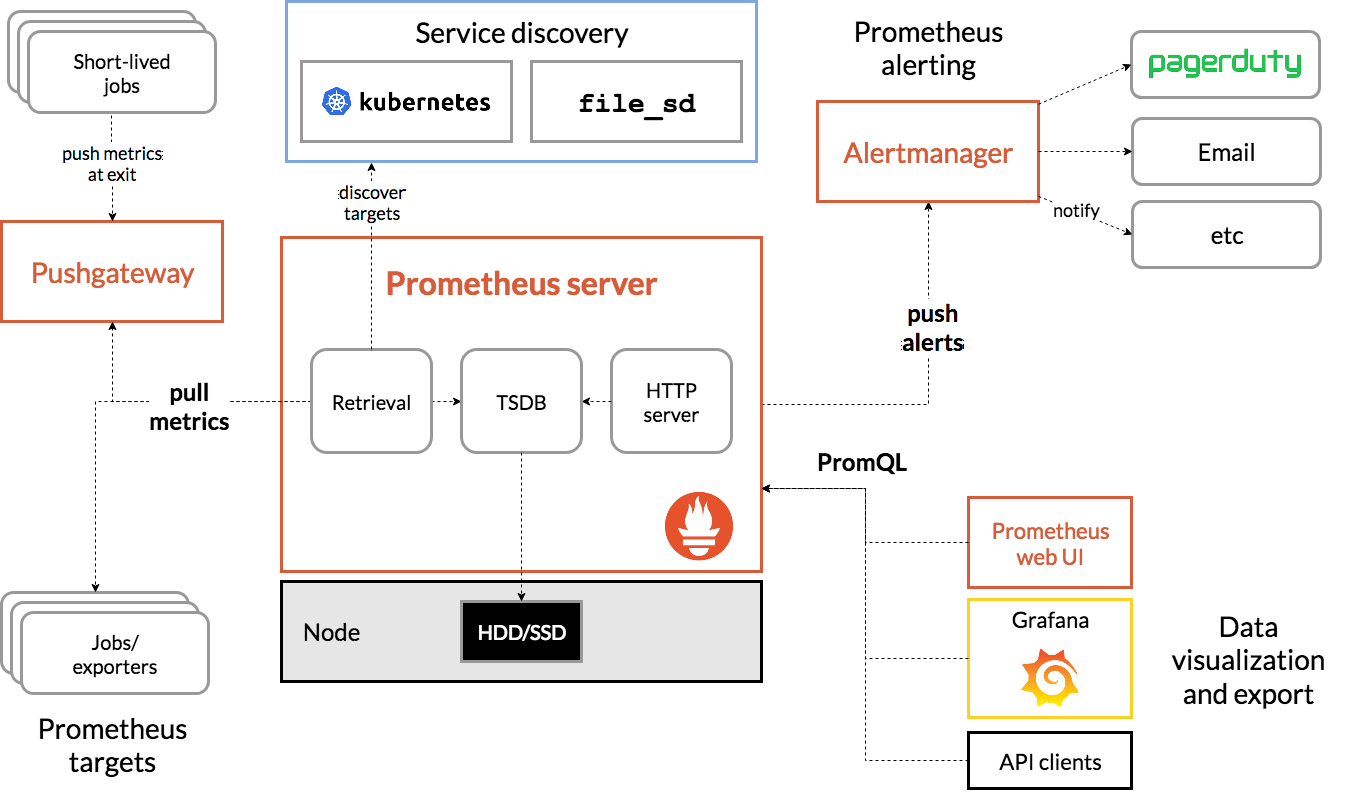
Prometheus scrapes metrics from instrumented jobs, either directly or via an intermediary push gateway for short-lived jobs. It stores all scraped samples locally and runs rules over this data to either aggregate and record new time series from existing data or generate alerts. Grafana or other API consumers can be used to visualize the collected data.
强大的查询语言PromQL
Prometheus内置了一个强大的数据查询语言PromQL。 通过PromQL可以实现对监控数据的查询、聚合。同时PromQL也被应用于数据可视化(如Grafana)以及告警当中。
通过PromQL可以轻松回答类似于以下问题:
- 在过去一段时间中95%应用延迟时间的分布范围?
- 预测在4小时后,磁盘空间占用大致会是什么情况?
- CPU占用率前5位的服务有哪些?(过滤)
ref https://swsmile.info/post/prometheus-promql/ for more details.
易于集成
使用Prometheus可以快速搭建监控服务,并且可以非常方便地在应用程序中进行集成。目前支持: Java, JMX, Python, Go,Ruby, .Net, Node.js等等语言的客户端SDK,基于这些SDK可以快速让应用程序纳入到Prometheus的监控当中,或者开发自己的监控数据收集程序。同时这些客户端收集的监控数据,不仅仅支持Prometheus,还能支持Graphite这些其他的监控工具。
同时Prometheus还支持与其他的监控系统进行集成:Graphite, Statsd, Collected, Scollector, muini, Nagios等。
Prometheus社区还提供了大量第三方实现的监控数据采集支持:JMX, CloudWatch, EC2, MySQL, PostgresSQL, Haskell, Bash, SNMP, Consul, Haproxy, Mesos, Bind, CouchDB, Django, Memcached, RabbitMQ, Redis, RethinkDB, Rsyslog等等。
从Node Exporter收集监控数据
为了能够让Prometheus Server能够从当前node exporter获取到监控数据,这里需要修改Prometheus配置文件。编辑prometheus.yml并在scrape_configs节点下添加以下内容:
scrape_configs:
  - job_name: 'prometheus'
    static_configs:
      - targets: ['localhost:9090']
  # 采集node exporter监控数据
  - job_name: 'node'
    static_configs:
      - targets: ['localhost:9100']
重新启动Prometheus Server,访问http://localhost:9090,进入到Prometheus Server。如果输入“up”并且点击执行按钮以后,可以看到如下结果:
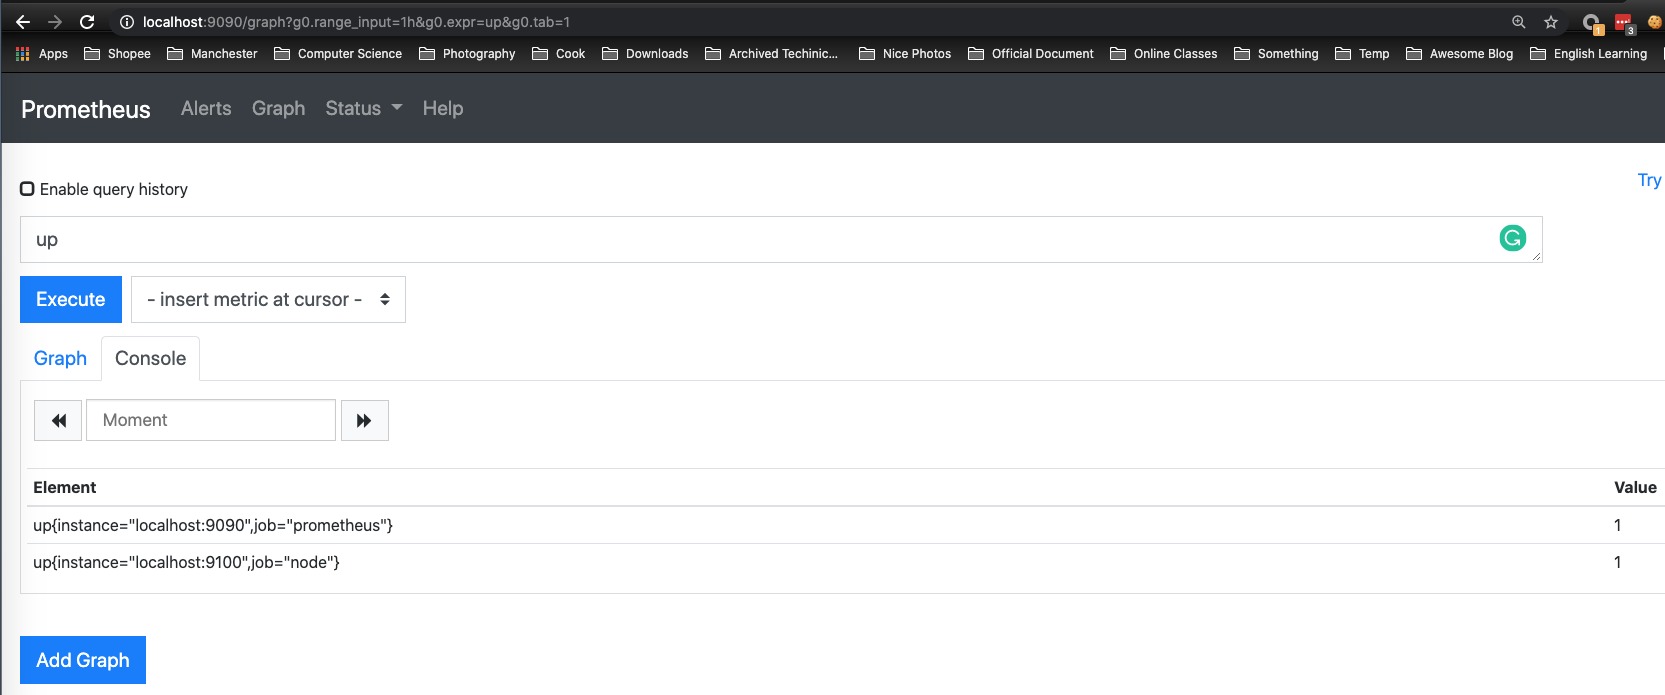
如果Prometheus能够正常从node exporter获取数据,则会看到以下结果:
up{instance="localhost:9090",job="prometheus"}    1
up{instance="localhost:9100",job="node"}    1
其中“1”表示正常,反之“0”则为异常。
使用PromQL查询监控数据
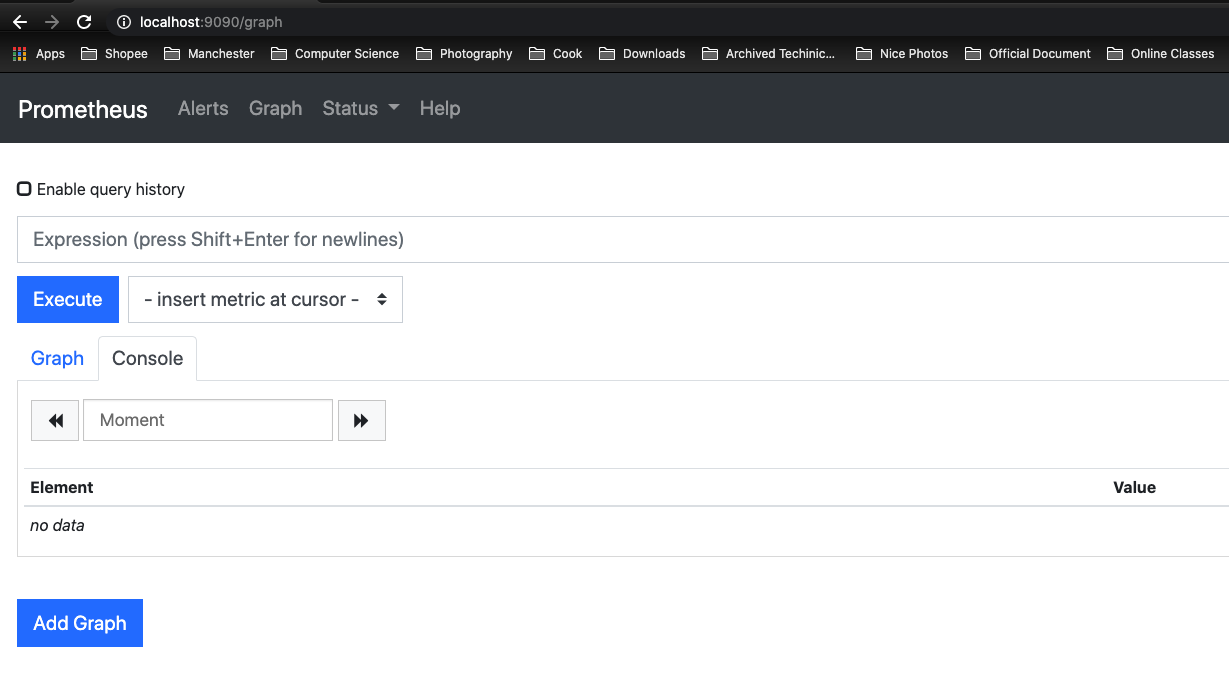
Prometheus UI是Prometheus内置的一个可视化管理界面,通过Prometheus UI用户能够轻松的了解Prometheus当前的配置,监控任务运行状态等。 通过Graph面板,用户还能直接使用PromQL实时查询监控数据:
切换到Graph面板,用户可以使用PromQL表达式查询特定监控指标的监控数据。如下所示,查询主机负载变化情况,可以使用关键字node_load1可以查询出Prometheus采集到的主机负载的样本数据,这些样本数据按照时间先后顺序展示,形成了主机负载随时间变化的趋势图表:
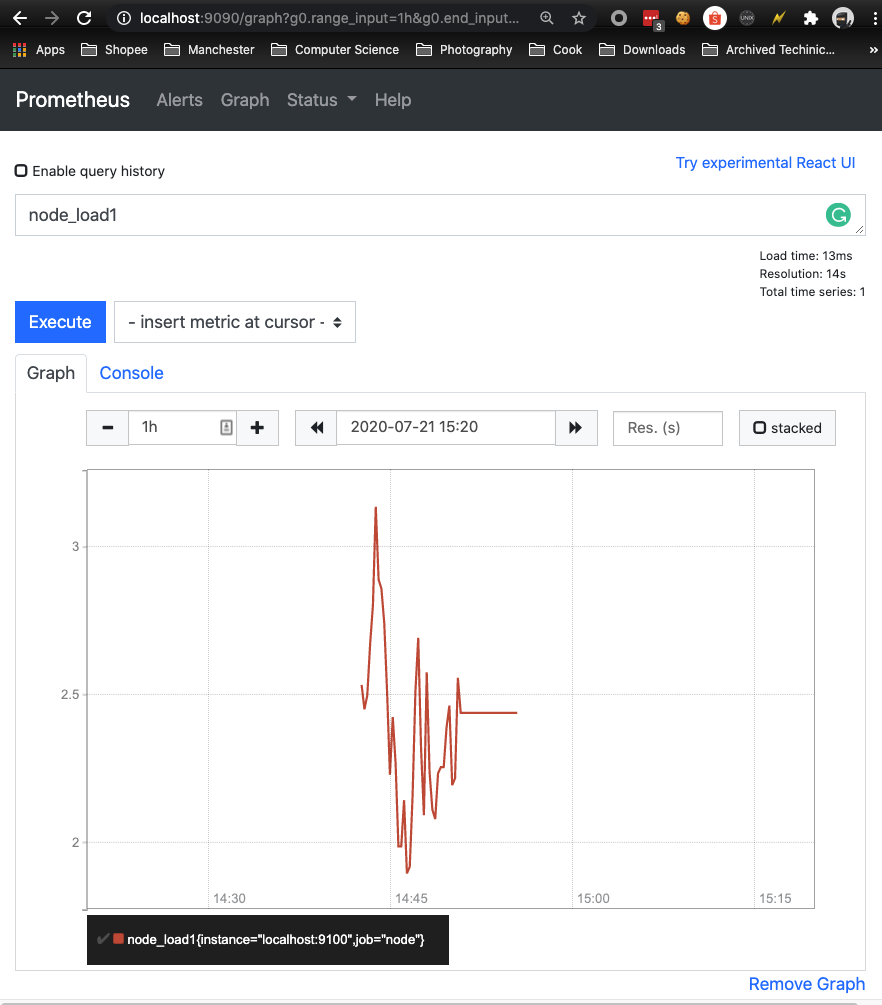
PromQL是Prometheus自定义的一套强大的数据查询语言,除了使用监控指标作为查询关键字以为,还内置了大量的函数,帮助用户进一步对时序数据进行处理。
可视化
Prometheus Server中自带了一个Prometheus UI,通过这个UI可以方便地直接对数据进行查询,并且支持直接以图形化的形式展示数据。同时Prometheus还提供了一个独立的基于Ruby On Rails的Dashboard解决方案Promdash。最新的Grafana可视化工具也已经提供了完整的Prometheus支持,基于Grafana可以创建更加精美的监控图标。基于Prometheus提供的API还可以实现自己的监控可视化UI。
Prometheus 接入Grafana
Prometheus UI提供了快速验证PromQL以及临时可视化支持的能力,而在大多数场景下引入监控系统通常还需要构建可以长期使用的监控数据可视化面板(Dashboard)。这时用户可以考虑使用第三方的可视化工具如Grafana,Grafana是一个开源的可视化平台,并且提供了对Prometheus的完整支持。
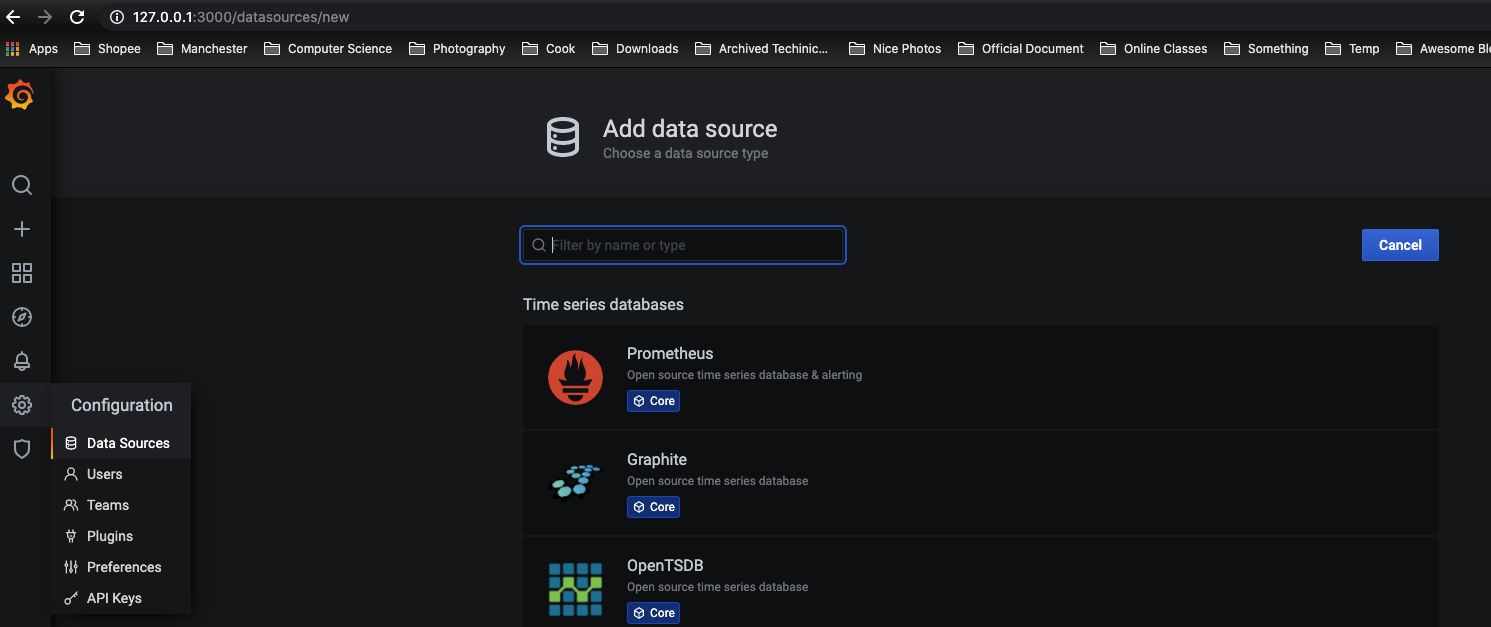
访问http://localhost:3000就可以进入到Grafana的界面中,默认情况下使用账户admin/admin进行登录。在Grafana首页中显示默认的使用向导,包括:安装、添加数据源、创建Dashboard、邀请成员、以及安装应用和插件等主要流程。
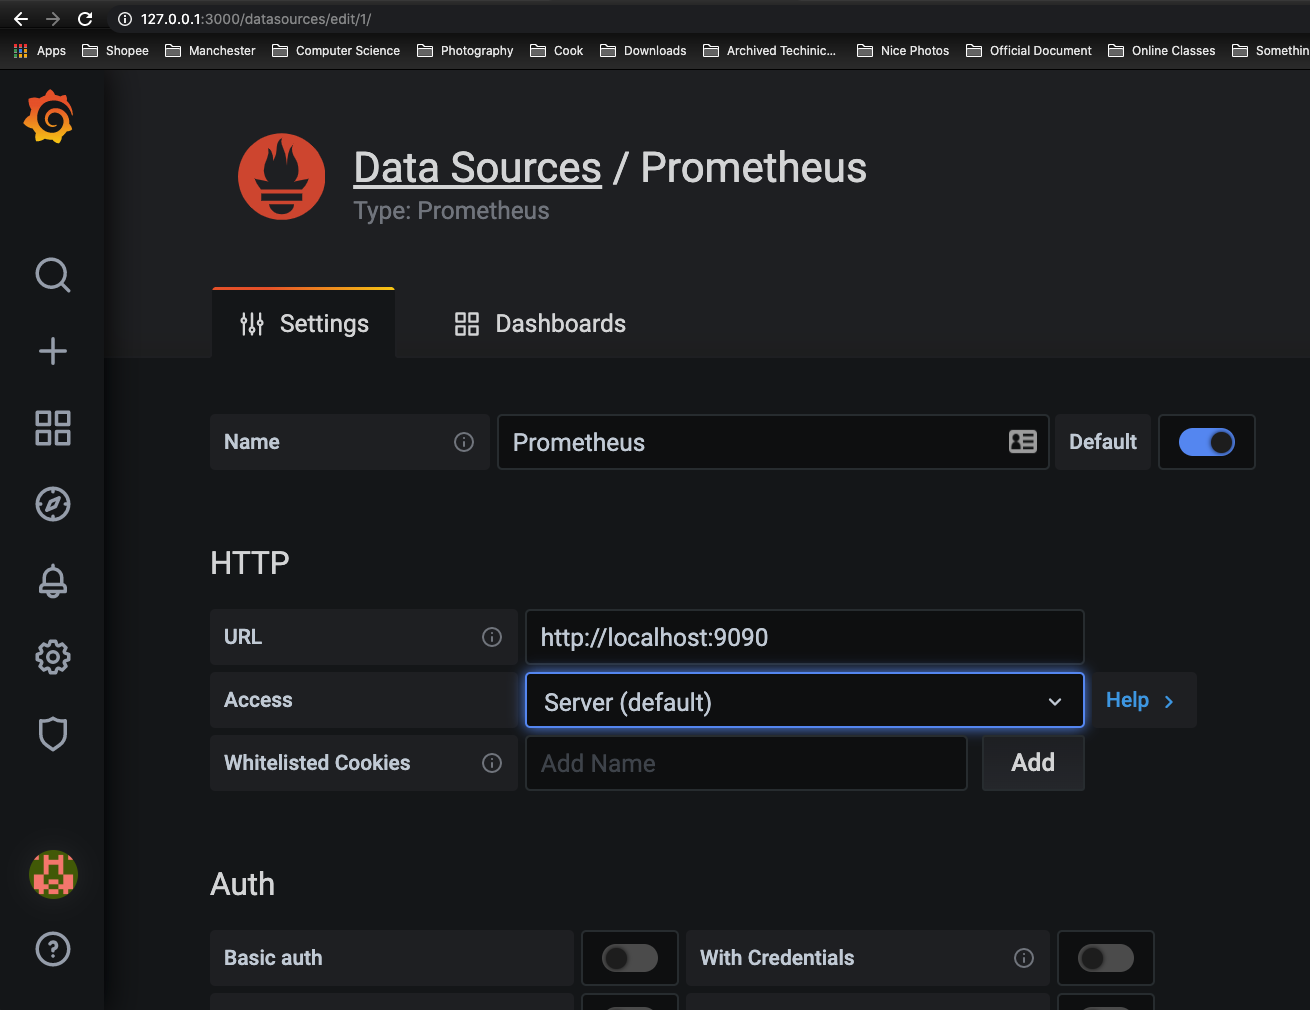
这里将添加Prometheus作为默认的数据源,如下图所示,指定数据源类型为Prometheus并且设置Prometheus的访问地址即可,在配置正确的情况下点击“Save & Test”按钮,会提示连接成功的信息。
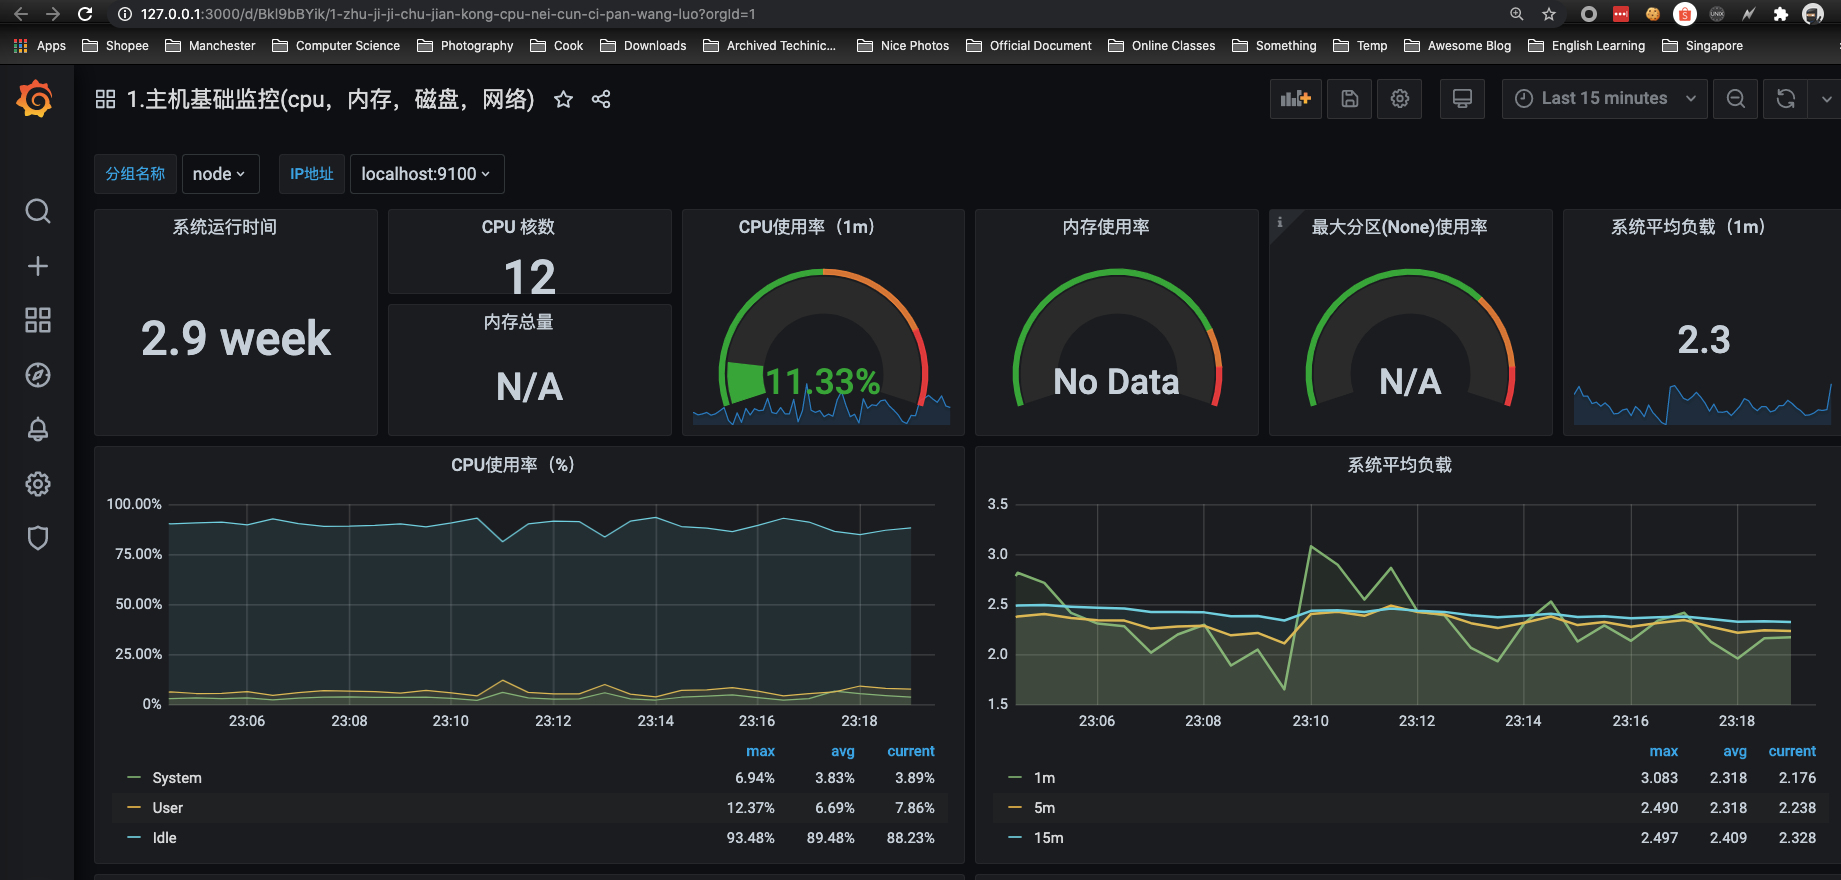
在完成数据源的添加之后就可以在Grafana中创建我们可视化Dashboard了。Grafana提供了对PromQL的完整支持。
通过Grafana添加Dashboard并且为该Dashboard添加一个类型为“Graph”的面板。 并在该面板的“Metrics”选项下通过PromQL查询需要可视化的数据。
Prometheus核心组件
下图展示Prometheus的基本架构:
Prometheus Server
Prometheus Server是Prometheus组件中的核心部分,负责实现对监控数据的获取,存储以及查询。 Prometheus Server可以通过静态配置管理监控目标,也可以配合使用Service Discovery的方式动态管理监控目标,并从这些监控目标中获取数据。其次Prometheus Server需要对采集到的监控数据进行存储,Prometheus Server本身就是一个时序数据库,将采集到的监控数据按照时间序列的方式存储在本地磁盘当中。最后Prometheus Server对外提供了自定义的PromQL语言,实现对数据的查询以及分析。
Prometheus Server内置的Express Browser UI,通过这个UI可以直接通过PromQL实现数据的查询以及可视化。
Prometheus Server的联邦集群能力可以使其从其他的Prometheus Server实例中获取数据,因此在大规模监控的情况下,可以通过联邦集群以及功能分区的方式对Prometheus Server进行扩展。
Exporters
Exporter将监控数据采集的端点通过HTTP服务的形式暴露给Prometheus Server,Prometheus Server通过访问该Exporter提供的Endpoint端点,即可获取到需要采集的监控数据。
一般来说可以将Exporter分为2类:
- 直接采集:这一类Exporter直接内置了对Prometheus监控的支持,比如cAdvisor,Kubernetes,Etcd,Gokit等,都直接内置了用于向Prometheus暴露监控数据的端点。
- 间接采集:间接采集,原有监控目标并不直接支持Prometheus,因此我们需要通过Prometheus提供的Client Library编写该监控目标的监控采集程序。例如: Mysql Exporter,JMX Exporter,Consul Exporter等。
Ref https://swsmile.info/post/prometheus-exporter/ for more details.
AlertManager
在Prometheus Server中支持基于PromQL创建告警规则,如果满足PromQL定义的规则,则会产生一条告警,而告警的后续处理流程则由AlertManager进行管理。在AlertManager中我们可以与邮件,Slack等等内置的通知方式进行集成,也可以通过Webhook自定义告警处理方式。AlertManager即Prometheus体系中的告警处理中心。
PushGateway
由于Prometheus数据采集基于Pull模型进行设计,因此在网络环境的配置上必须要让Prometheus Server能够直接与Exporter进行通信。 当这种网络需求无法直接满足时,就可以利用PushGateway来进行中转。可以通过PushGateway将内部网络的监控数据主动Push到Gateway当中。而Prometheus Server则可以采用同样Pull的方式从PushGateway中获取到监控数据。
Exporter
广义上讲所有可以向Prometheus提供监控样本数据的程序都可以被称为一个Exporter。而Exporter的一个实例称为target,如下所示,Prometheus通过轮询的方式定期从这些target中获取样本数据:

Exporter的来源
从Exporter的来源上来讲,主要分为两类:
- 社区提供的
Prometheus社区提供了丰富的Exporter实现,涵盖了从基础设施,中间件以及网络等各个方面的监控功能。这些Exporter可以实现大部分通用的监控需求。下表列举一些社区中常用的Exporter:
| 范围 | 常用Exporter |
|---|---|
| 数据库 | MySQL Exporter, Redis Exporter, MongoDB Exporter, MSSQL Exporter等 |
| 硬件 | Apcupsd Exporter,IoT Edison Exporter, IPMI Exporter, Node Exporter等 |
| 消息队列 | Beanstalkd Exporter, Kafka Exporter, NSQ Exporter, RabbitMQ Exporter等 |
| 存储 | Ceph Exporter, Gluster Exporter, HDFS Exporter, ScaleIO Exporter等 |
| HTTP服务 | Apache Exporter, HAProxy Exporter, Nginx Exporter等 |
| API服务 | AWS ECS Exporter, Docker Cloud Exporter, Docker Hub Exporter, GitHub Exporter等 |
| 日志 | Fluentd Exporter, Grok Exporter等 |
| 监控系统 | Collectd Exporter, Graphite Exporter, InfluxDB Exporter, Nagios Exporter, SNMP Exporter等 |
| 其它 | Blockbox Exporter, JIRA Exporter, Jenkins Exporter, Confluence Exporter等 |
- 用户自定义的
除了直接使用社区提供的Exporter程序以外,用户还可以基于Prometheus提供的Client Library创建自己的Exporter程序,目前Promthues社区官方提供了对以下编程语言的支持:Go、Java/Scala、Python、Ruby。同时还有第三方实现的如:Bash、C++、Common Lisp、Erlang,、Haskeel、Lua、Node.js、PHP、Rust等。
Exporter的运行方式
从Exporter的运行方式上来讲,又可以分为:
- 独立使用的
以我们已经使用过的Node Exporter为例,由于操作系统本身并不直接支持Prometheus,同时用户也无法通过直接从操作系统层面上提供对Prometheus的支持。因此,用户只能通过独立运行一个程序的方式,通过操作系统提供的相关接口,将系统的运行状态数据转换为可供Prometheus读取的监控数据。 除了Node Exporter以外,比如MySQL Exporter、Redis Exporter等都是通过这种方式实现的。 这些Exporter程序扮演了一个中间代理人的角色。
- 集成到应用中的
为了能够更好的监控系统的内部运行状态,有些开源项目如Kubernetes,ETCD等直接在代码中使用了Prometheus的Client Library,提供了对Prometheus的直接支持。这种方式打破的监控的界限,让应用程序可以直接将内部的运行状态暴露给Prometheus,适合于一些需要更多自定义监控指标需求的项目。
Exporter规范
所有的Exporter程序都需要按照Prometheus的规范,返回监控的样本数据。以Node Exporter为例,当访问/metrics地址时会返回以下内容:
# HELP node_cpu Seconds the cpus spent in each mode.
# TYPE node_cpu counter
node_cpu{cpu="cpu0",mode="idle"} 362812.7890625
# HELP node_load1 1m load average.
# TYPE node_load1 gauge
node_load1 3.0703125
这是一种基于文本的格式规范,在Prometheus 2.0之前的版本还支持Protocol buffer规范。相比于Protocol buffer文本具有更好的可读性,以及跨平台性。Prometheus 2.0的版本也已经不再支持Protocol buffer,这里就不对Protocol buffer规范做详细的阐述。
Exporter返回的样本数据,主要由三个部分组成:样本的一般注释信息(HELP),样本的类型注释信息(TYPE)和样本。Prometheus会对Exporter响应的内容逐行解析:
如果当前行以# HELP开始,Prometheus将会按照以下规则对内容进行解析,得到当前的指标名称以及相应的说明信息:
# HELP <metrics_name> <doc_string>
如果当前行以# TYPE开始,Prometheus会按照以下规则对内容进行解析,得到当前的指标名称以及指标类型:
# TYPE <metrics_name> <metrics_type>
TYPE注释行必须出现在指标的第一个样本之前。如果没有明确的指标类型需要返回为untyped。 除了# 开头的所有行都会被视为是监控样本数据。 每一行样本需要满足以下格式规范:
metric_name [
  "{" label_name "=" `"` label_value `"` { "," label_name "=" `"` label_value `"` } [ "," ] "}"
] value [ timestamp ]
其中metric_name和label_name必须遵循PromQL的格式规范要求。value是一个float格式的数据,timestamp的类型为int64(从1970-01-01 00:00:00以来的毫秒数),timestamp为可选默认为当前时间。具有相同metric_name的样本必须按照一个组的形式排列,并且每一行必须是唯一的指标名称和标签键值对组合。
需要特别注意的是对于histogram和summary类型的样本。需要按照以下约定返回样本数据:
- 类型为summary或者histogram的指标x,该指标所有样本的值的总和需要使用一个单独的x_sum指标表示。
- 类型为summary或者histogram的指标x,该指标所有样本的总数需要使用一个单独的x_count指标表示。
- 对于类型为summary的指标x,其不同分位数quantile所代表的样本,需要使用单独的x{quantile=“y”}表示。
- 对于类型histogram的指标x为了表示其样本的分布情况,每一个分布需要使用x_bucket{le=“y”}表示,其中y为当前分布的上位数。同时必须包含一个样本x_bucket{le="+Inf"},并且其样本值必须和x_count相同。
- 对于histogram和summary的样本,必须按照分位数quantile和分布le的值的递增顺序排序。
以下是类型为histogram和summary的样本输出示例:
# A histogram, which has a pretty complex representation in the text format:
# HELP http_request_duration_seconds A histogram of the request duration.
# TYPE http_request_duration_seconds histogram
http_request_duration_seconds_bucket{le="0.05"} 24054
http_request_duration_seconds_bucket{le="0.1"} 33444
http_request_duration_seconds_bucket{le="0.2"} 100392
http_request_duration_seconds_bucket{le="+Inf"} 144320
http_request_duration_seconds_sum 53423
http_request_duration_seconds_count 144320


# Finally a summary, which has a complex representation, too:
# HELP rpc_duration_seconds A summary of the RPC duration in seconds.
# TYPE rpc_duration_seconds summary
rpc_duration_seconds{quantile="0.01"} 3102
rpc_duration_seconds{quantile="0.05"} 3272
rpc_duration_seconds{quantile="0.5"} 4773
rpc_duration_seconds_sum 1.7560473e+07
rpc_duration_seconds_count 2693
对于某些Prometheus还没有提供支持的编程语言,用户只需要按照以上规范返回响应的文本数据即可。
Prometheus Configuration
Configuring Prometheus to monitor itself
Prometheus collects metrics from monitored targets by scraping metrics HTTP endpoints on these targets. Since Prometheus also exposes data in the same manner about itself, it can also scrape and monitor its own health.
While a Prometheus server that collects only data about itself is not very useful in practice, it is a good starting example. Save the following basic Prometheus configuration as a file named prometheus.yml:
global:
  scrape_interval:     15s # By default, scrape targets every 15 seconds.

  # Attach these labels to any time series or alerts when communicating with
  # external systems (federation, remote storage, Alertmanager).
  external_labels:
    monitor: 'codelab-monitor'

# A scrape configuration containing exactly one endpoint to scrape:
# Here it's Prometheus itself.
scrape_configs:
  # The job name is added as a label `job=<job_name>` to any timeseries scraped from this config.
  - job_name: 'prometheus'

    # Override the global default and scrape targets from this job every 5 seconds.
    scrape_interval: 5s

    static_configs:
      - targets: ['localhost:9090']
For a complete specification of configuration options, see the configuration documentation.
Prometheus Configuration
global:
  scrape_interval:     15s
  evaluation_interval: 15s

rule_files:
  # - "first.rules"
  # - "second.rules"

scrape_configs:
  - job_name: prometheus
    static_configs:
      - targets: ['localhost:9090']
The last block, scrape_configs, controls what resources Prometheus monitors. Since Prometheus also exposes data about itself as an HTTP endpoint it can scrape and monitor its own health. In the default configuration there is a single job, called prometheus, which scrapes the time series data exposed by the Prometheus server. The job contains a single, statically configured, target, the localhost on port 9090. Prometheus expects metrics to be available on targets on a path of /metrics. So this default job is scraping via the URL: http://localhost:9090/metrics.
For a complete specification of configuration options, see the configuration documentation.
Alternatives
- https://prometheus.io/docs/introduction/comparison/
- https://grafana.com/blog/2016/01/05/logs-and-metrics-and-graphs-oh-my/
Prometheus vs InfluxDB
ref https://swsmile.info/post/InfluxDB-learning/
Reference
- https://github.com/prometheus/prometheus
- https://prometheus.io/docs/prometheus/
- https://prometheus.io/docs/introduction/first_steps/
- https://prometheus.io/docs/prometheus/latest/installation/
- https://prometheus.io/docs/guides/node-exporter/