Situation
我们都知道,如果你知道在 TrueNAS OS 中通过 pkg 来安装软件,会得到下面的错误:
$ pkg install git
Updating local repository catalogue...
pkg: file:///usr/ports/packages/meta.txz: No such file or directory
repository local has no meta file, using default settings
pkg: file:///usr/ports/packages/packagesite.txz: No such file or directory
Unable to update repository local
Error updating repositories!
事实上,官方 doc 中有明确说到:我们不应该在 TrueNAS OS 中安装你想安装的软件,而是把这些软件安装在 Jail 里面。
问题来了,如果我想使用 Node Exporter 监控 TrueNAS 宿主机。
(实在是看不习惯 TrueNAS 自带的监控)
那么如果我把 Node Exporter 安装在 Jail instance里面,那么自然监控的是 Jail 本身,而不是 TrueNAS 宿主机。
Solution
# 先在 Jail 里安装软件,比如 node_exporter
root@MyJail:~ # pkg install node_exporter
root@MyJail:~ # which node_exporter
/usr/local/bin/node_exporter
# 在 TreeNAS host 下找到这个 Jail 的 go 的 binary 然后运行
# 当然,你需要根据你为你的 Jail 设置的路径,来修改 mnt/SWPoolSSD/iocage/jails/MyJail
# 可以看到一切运行正常
root@sw-truenas[...ocage/jails/MyJail/root/usr/local/bin]# /mnt/SWPoolSSD/iocage/jails/MyJail/root/usr/local/bin/node_exporter
...
# Test, curl 一下,看看是否能够正常拿到 metrics
$ curl 127.0.0.1:9100/metrics
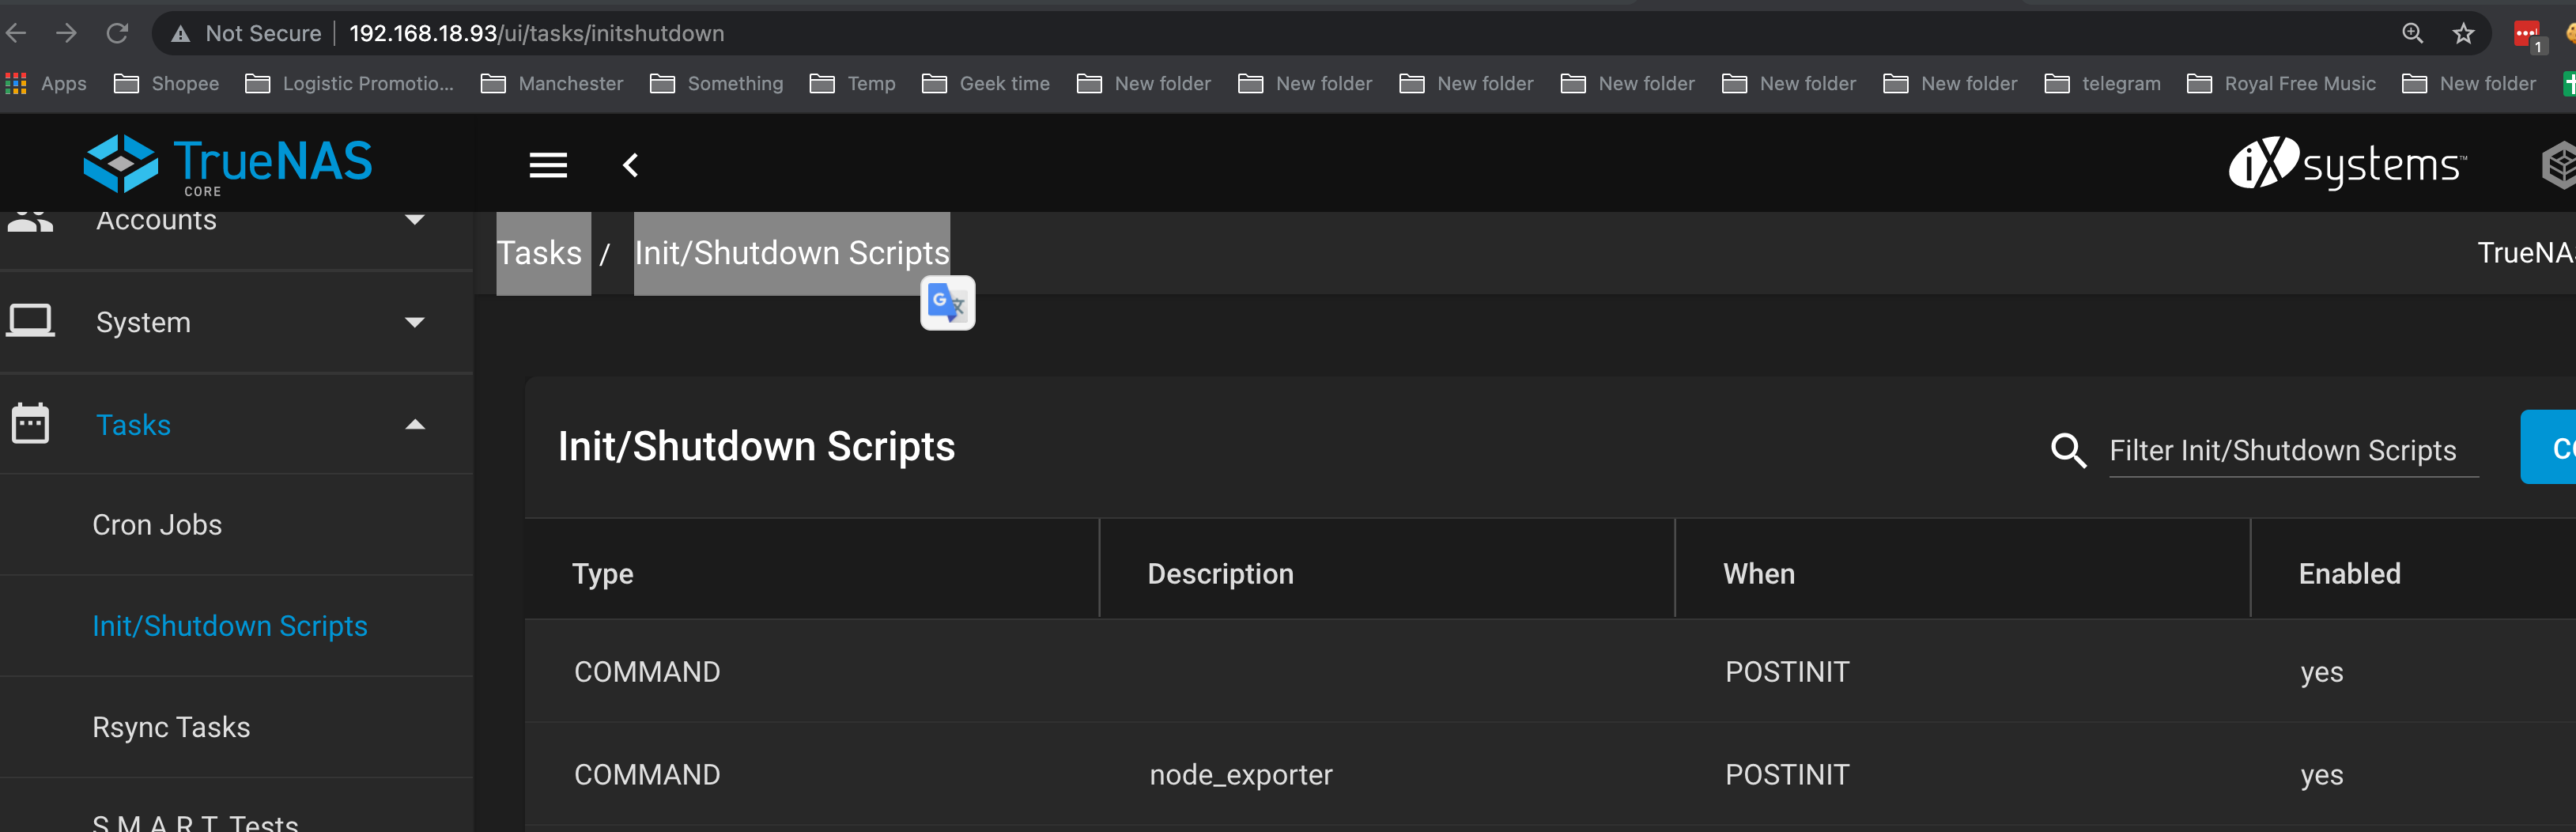
# 在 TasksInit/Shutdown Scripts 中配置
/mnt/SSDPool2/iocage/jails/SWJail/root/usr/local/bin/node_exporter
Node Exporter 正常工作后,在 Prometheus Server 的 prometheus.yml 中增加这个 Node 的采集点:
scrape_configs:
  # The job name is added as a label `job=<job_name>` to any timeseries scraped from this config.
  - job_name: 'prometheus'

    # metrics_path defaults to '/metrics'
    # scheme defaults to 'http'.

    static_configs:
    - targets: ['localhost:9090']

  - job_name: 'node'
    static_configs:
      # For TrueNAS monitor
      - targets: ['192.168.18.33:9100']
配置完成后,重启一下在 Prometheus Server。
在在 Prometheus Server UI 中 double-check 一下metric 能被正常采集:
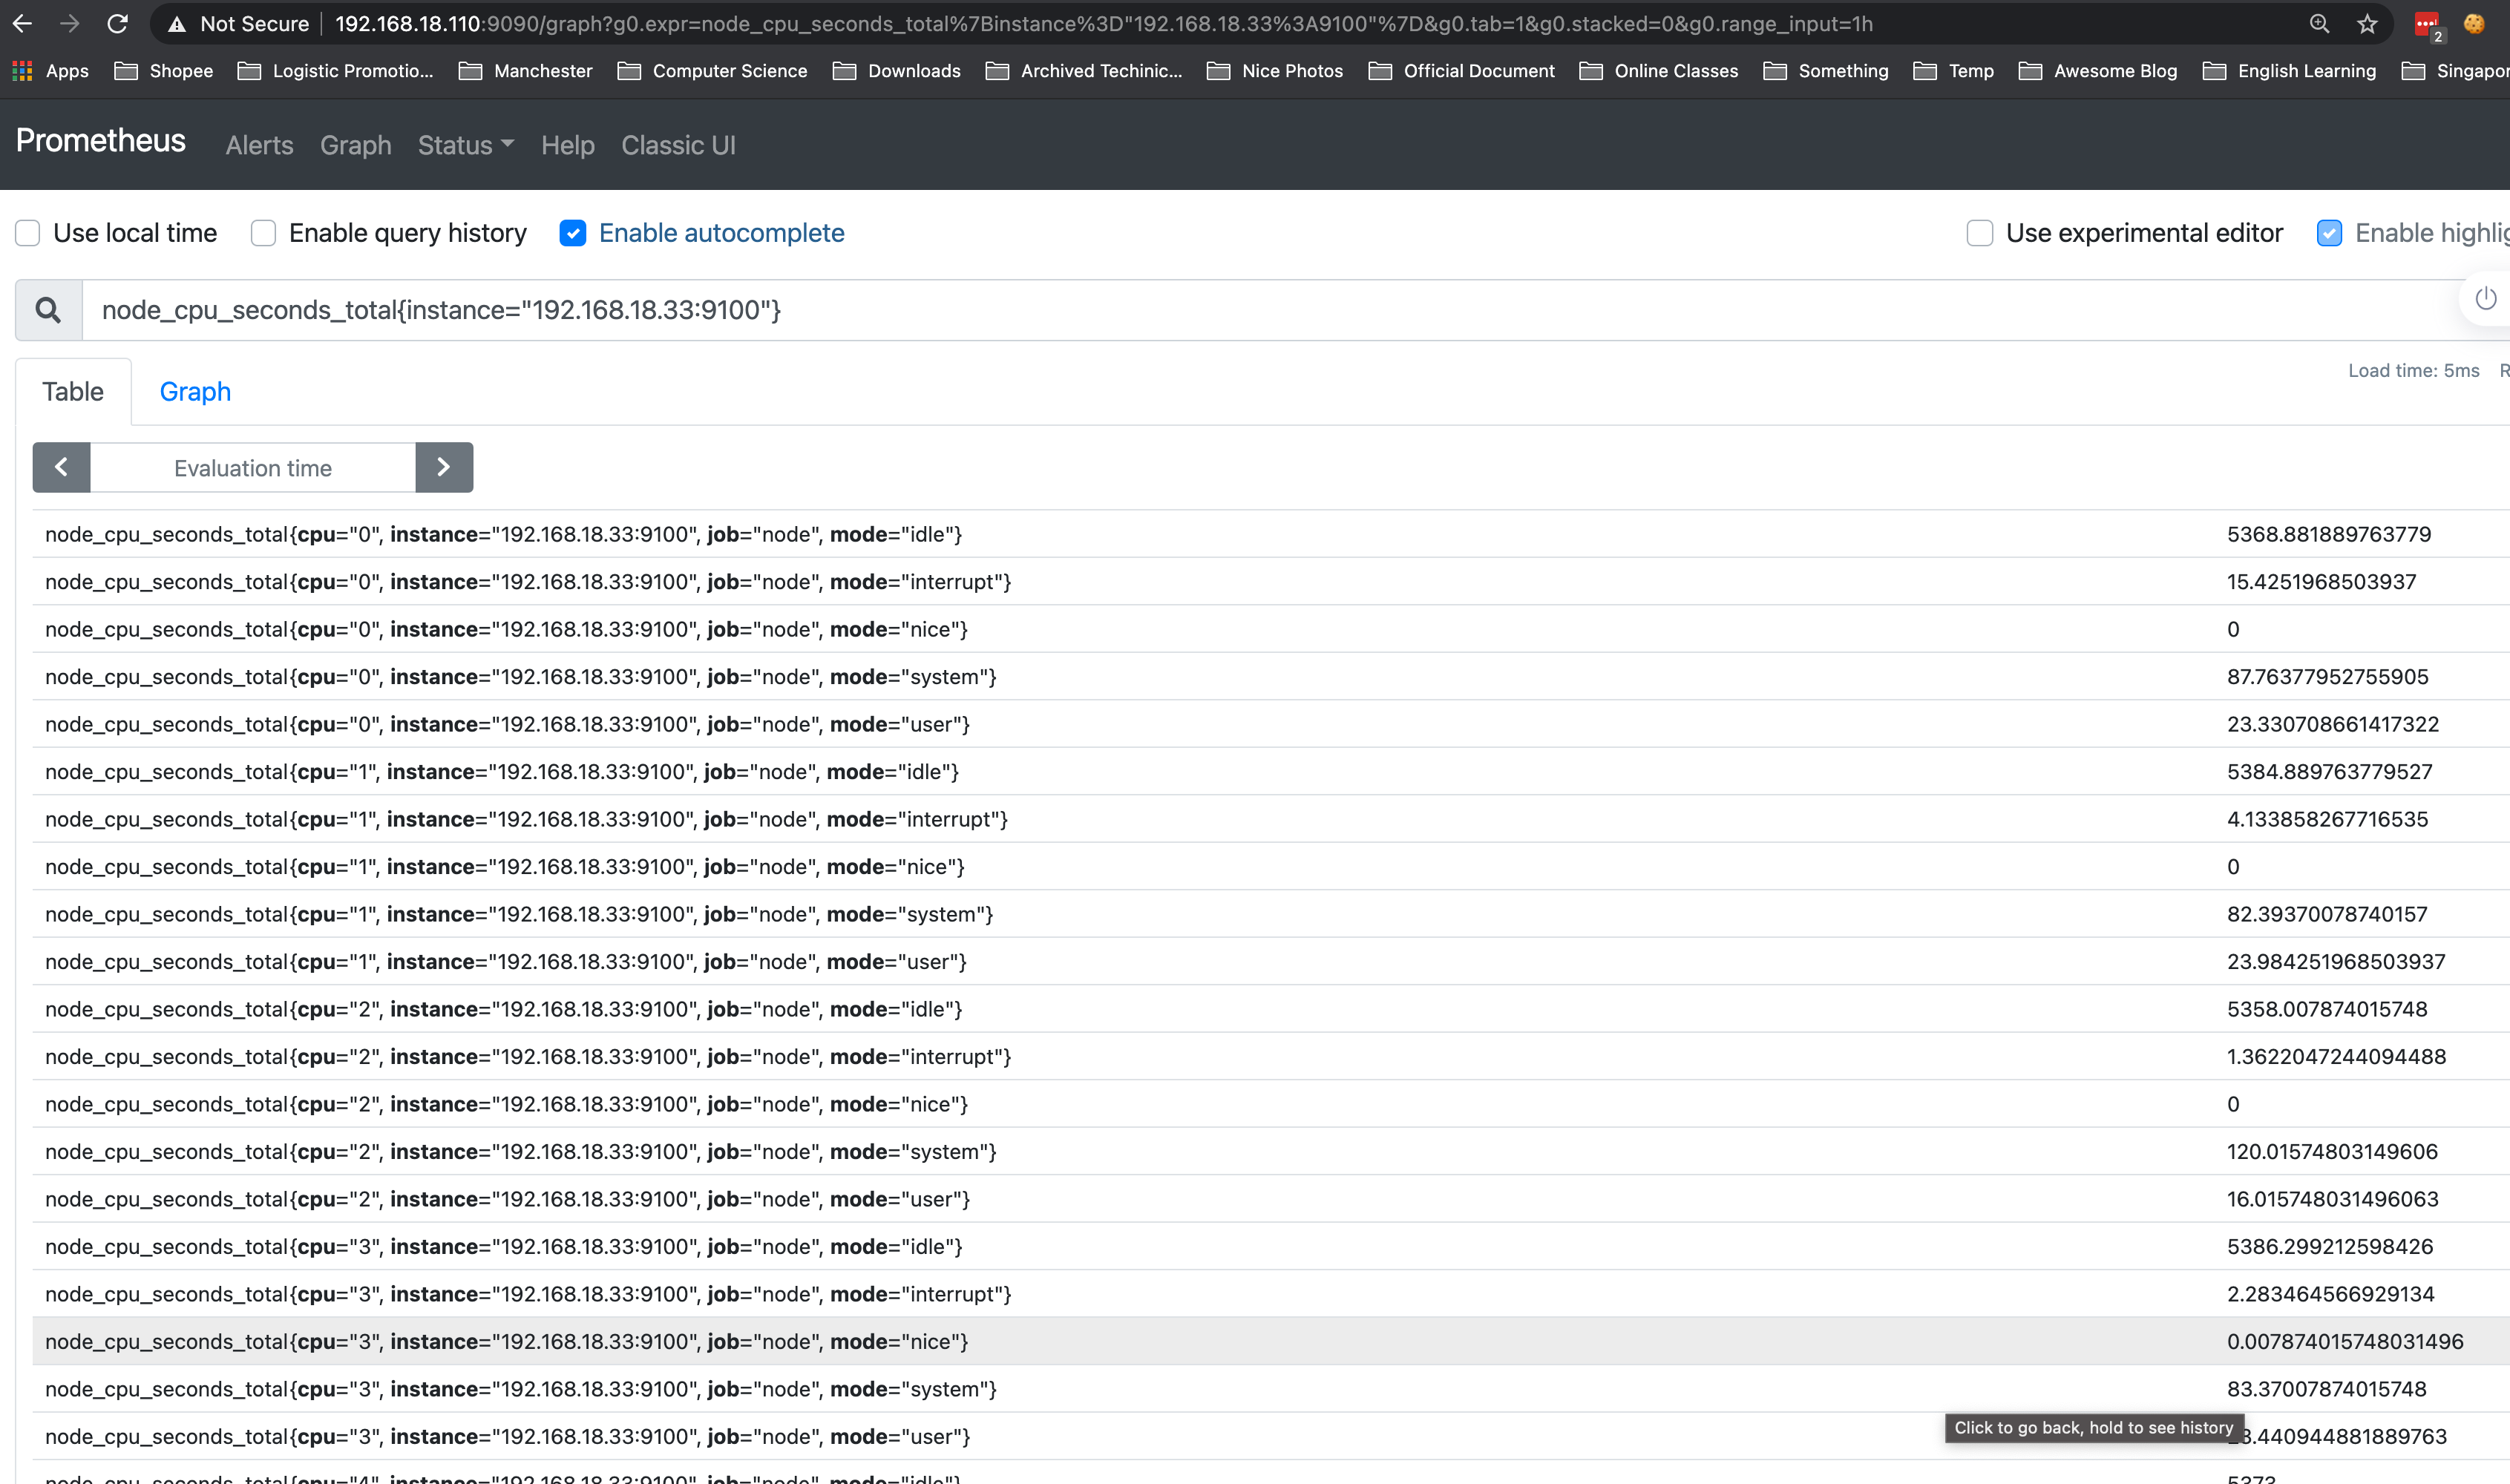
完美!
在 Grafana 中:

Grafana Dashboard for FreeBSD Node Exporter: https://grafana.com/grafana/dashboards/1860
举一反三,这个方法适用于任何希望在TrueNAS OS 中运行第三方软件软件,比如 go 等等。
Reference
- https://unix.stackexchange.com/questions/301640/how-to-pkg-upgrade-on-freenas-freebsd
- https://www.truenas.com/community/threads/new-in-freenas-unable-to-do-pkg-update.49672/
- https://digimoot.wordpress.com/2019/10/12/freenas-no-packages-available-to-install-have-been-found-in-the-repositories/
- https://www.truenas.com/community/threads/how-to-install-custom-packages-on-freenas.38234/