- 所有的Exporter:https://prometheus.io/docs/instrumenting/exporters/#exporters-and-integrations
- Redis Exporter:https://github.com/oliver006/redis_exporter
- Golang Exporter:https://github.com/prometheus/mysqld_exporter
【Prometheus】Prometheus - Node Exporter
安装Node Exporter
在Prometheus的架构设计中,Prometheus Server并不直接服务监控特定的目标,其主要任务负责数据的收集,存储并且对外提供数据查询支持。因此为了能够能够监控到某些东西,如主机的CPU使用率,我们需要使用到Exporter。Prometheus周期性的从Exporter暴露的HTTP服务地址(通常是/metrics)拉取监控样本数据。
xporter可以是一个相对开放的概念,其可以是一个独立运行的程序独立于监控目标以外,也可以是直接内置在监控目标中。只要能够向Prometheus提供标准格式的监控样本数据即可。
这里为了能够采集到主机的运行指标如CPU, 内存,磁盘等信息。我们可以使用Node Exporter 。
Node Exporter同样采用Golang编写,并且不存在任何的第三方依赖,只需要下载,解压即可运行。可以从 https://prometheus.io/download/ 获取最新的node exporter版本的二进制包。
...【Prometheus】Prometheus 初入
Prometheus
Prometheus, a Cloud Native Computing Foundation project, is a systems and service monitoring system. It collects metrics from configured targets at given intervals, evaluates rule expressions, displays the results, and can trigger alerts if some condition is observed to be true.
Prometheus’s main distinguishing features as compared to other monitoring systems are:
- a multi-dimensional data model (timeseries defined by metric name and set of key/value dimensions)
- a flexible query language to leverage this dimensionality
- no dependency on distributed storage; single server nodes are autonomous
- timeseries collection happens via a pull model over HTTP
- pushing timeseries is supported via an intermediary gateway
- targets are discovered via service discovery or static configuration
- multiple modes of graphing and dashboarding support
- support for hierarchical and horizontal federation
Architecture overview
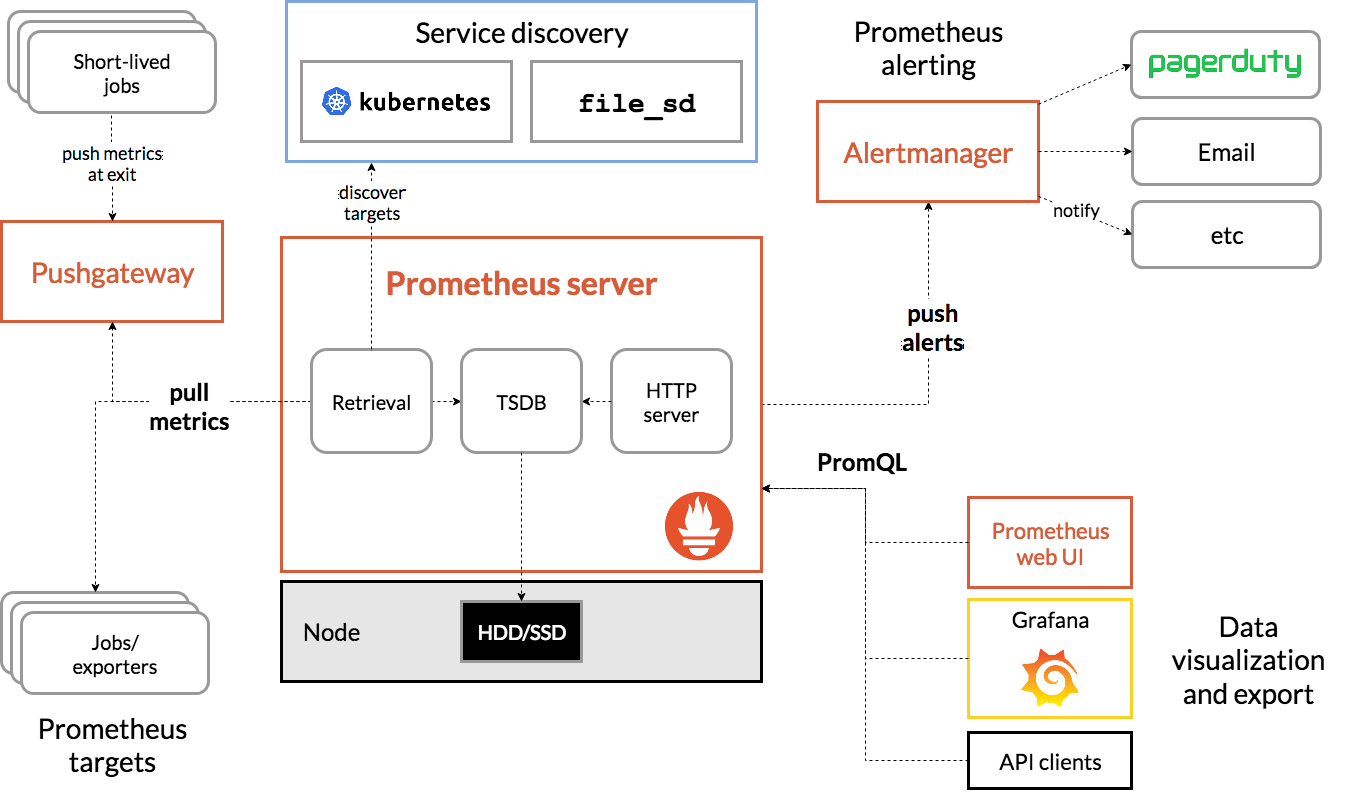
Prometheus scrapes metrics from instrumented jobs, either directly or via an intermediary push gateway for short-lived jobs. It stores all scraped samples locally and runs rules over this data to either aggregate and record new time series from existing data or generate alerts. Grafana or other API consumers can be used to visualize the collected data.
强大的查询语言PromQL
Prometheus内置了一个强大的数据查询语言PromQL。 通过PromQL可以实现对监控数据的查询、聚合。同时PromQL也被应用于数据可视化(如Grafana)以及告警当中。
通过PromQL可以轻松回答类似于以下问题:
- 在过去一段时间中95%应用延迟时间的分布范围?
- 预测在4小时后,磁盘空间占用大致会是什么情况?
- CPU占用率前5位的服务有哪些?(过滤)
ref https://swsmile.info/post/prometheus-promql/ for more details.
...【Grafana】配置
Grafana
grafana是一个非常酷的数据可视化平台,常常应用于显示监控数据。
配置数据源(Data Sources)
本篇主要介绍了Grafana基于MySQL数据源的安装及常用姿势,也支持其他数据源如ElasticSearch、InfluxDB、Zabbix、Prometheus、Druid、influxDb、MySQL、graphite等。
Supported data sources
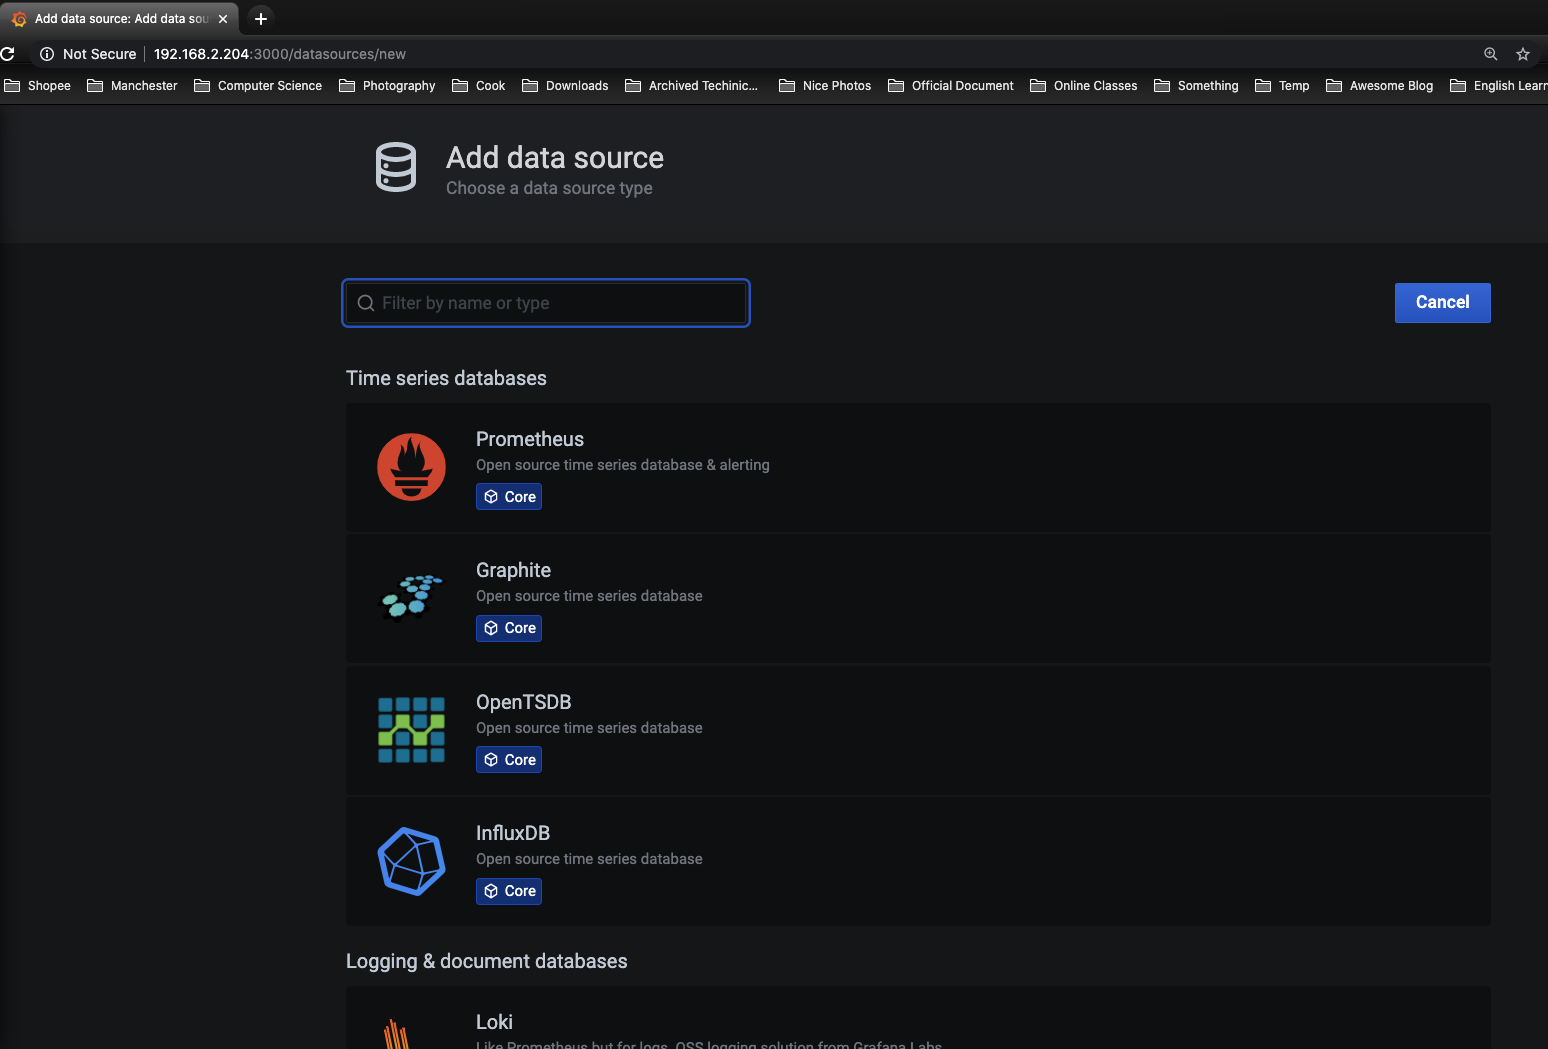
The following data sources are officially supported:
- AWS CloudWatch
- Azure Monitor
- Elasticsearch
- Google Cloud Monitoring
- Graphite
- InfluxDB
- Loki
- Microsoft SQL Server (MSSQL)
- MySQL
- OpenTSDB
- PostgreSQL
- Prometheus
- Testdata
【Software Testing】App 自动化测试框架 - Appium
Background
XCUITest Driver
Appium’s primary support for automating iOS apps is via the XCUITest driver. (New to Appium? Read our introduction to Appium drivers). This driver leverages Apple’s XCUITest libraries under the hood in order to facilitate automation of your app . This access to XCUITest is mediated by the WebDriverAgent server.
WebDriverAgent
WebDriverAgent (also referred to as “WDA”) is a project managed by Facebook, to which the Appium core team contributes heavily. WDA is a WebDriver-compatible server that runs in the context of an iOS simulator or device and exposes the XCUITest API. Appium’s XCUITest driver manages WDA as a subprocess opaque to the Appium user, proxies commands to/from WDA, and provides a host of additional functionality (like simulator management and other methods, for example).
WebDriver Protocol
When all is said and done, Appium is just an HTTP server. It sits and waits for connections from a client, which then instructs Appium what kind of session to start and what kind of automation behaviors to enact once a session is started. This means that you never use Appium just by itself. You always have to use it with a client library of some kind (or, if you’re adventurous, cURL!).
Luckily, Appium speaks the same protocol as Selenium, called the WebDriver Protocol. You can do a lot of things with Appium just by using one of the standard Selenium clients. You may even have one of these on your system already. It’s enough to get started, especially if you’re using Appium for the purpose of testing web browsers on mobile platforms.
...